Section 4.5: Investment
Hypothesis:
Private investment demand and public investment into infrastructure is relatively low in the region. Both of these constrain productivity growth in the West Midlands.
Private investment. Underinvestment has been chronic in the UK economy for decades for several underlying structural reasons. Post-2010 austerity measures have particularly weakened public investment, while the 2008 financial crash, closely followed by Brexit, has negatively impacted private investment. Evidence points to the unequal distribution of capital investment across UK regions, showing significant variation both between high- and low- productivity regions and within regions themselves. By way of example, from 2011-2017, public and private investment demand in the West Midlands lagged London by 12% and 25% respectively.
Research by Ben Gardiner has attempted to untangle the relationship between capital stocks and productivity at a regional level. It shows that capital intensity (capital stock per capita) has a positive effect on labour productivity, especially in manufacturing sectors, where the authors point to the rising significance of automation. They also note that investment in business services, especially in information and communication technologies (ICT), understates the significance of investment in promoting labour productivity growth. ICT investment can have a transformative effect on business activity, although evidence from the last 15 years suggests that the benefits of the ICT revolution have not yet been realised in higher levels of economic growth.
The best comparative measure of capital investment is Gross Fixed Capital Formation, which ONS produce at national, ITL1 and ITL2 levels on an experimental basis. Comparing ITL2 areas shows that the West Midlands has performed slightly below comparator areas in capital investment since the 2008 financial crash.
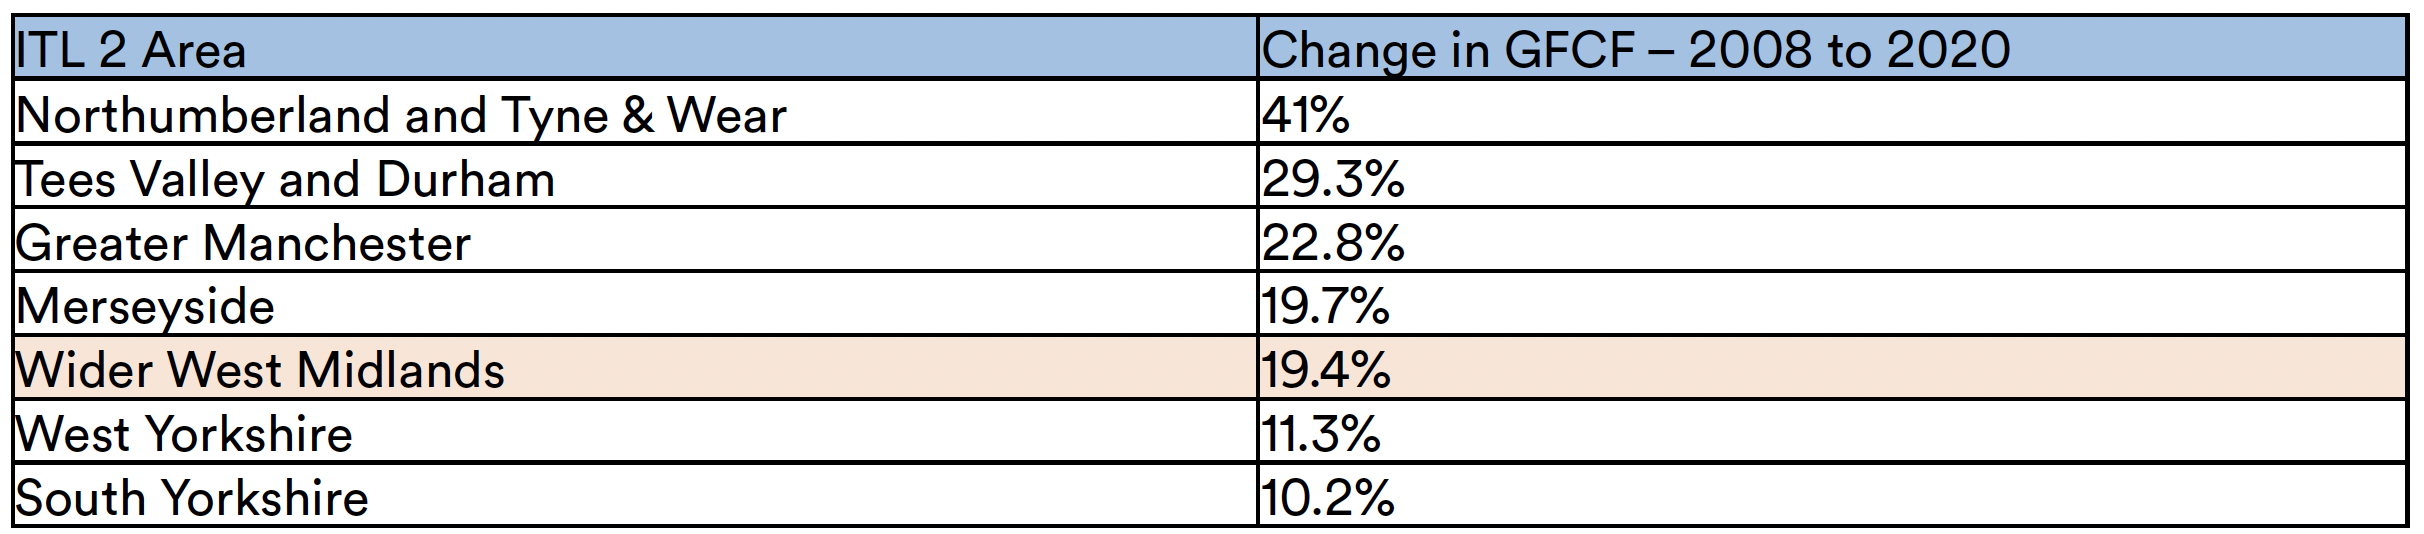
Figure 21: Change in Gross Fixed Capital Formation 2008 to 2020.
There is relatively little in-depth research on regional capital investment in the UK due largely to data limitations. Indeed, Zymek and Jones in their 2020 evidence review for the then Industrial Strategy Council and Levelling Up White Paper (UK Government, 2022) both noted the lack of available data and research on regional capital investment and stocks in the UK.
Across the wider literature that does exist on regional, non-London economies, there is evidence that investment financing is an outcome of both supply and demand conditions but that demand conditions are likely to be more influential: financial investment in a region is likely to be low because the returns to this investment are low, and not because of supply constraints. While there is some evidence that a lack of access to equity financing in particular may be constraining an (important) subset of high growth potential SMEs, the supply of capital isn’t a barrier in regional economies.
Wilson, Kacer, and Wright (2019) analysed all equity investments in SMEs in the UK 2011-17, and found that 90% of variation in deal flow can be explained by three differences in regions’ economic structure, and therefore the investable opportunities in the region: the number of SMEs, the share of “high-growth firms”, and the share of firms in high-tech manufacturing or knowledge-intensive services, implying that the composition of businesses in the economy and the quality of those businesses and how they are led and managed were the key to securing private equity investment.
McCann et al put forward an explanation of the UK’s regional investment problem, arguing that the 2008 Global Financial Crisis triggered profound capital market shocks which were asymmetric across UK regions and which subsequently favoured the UK’s most prosperous regions, most notably London. The underlying signals used by McCann et al of how financial markets evaluate different places in terms of relative commercial risk pricing were obtained from detailed commercial real estate investment data, and their research suggests that there is a 250 to 300 basis points ‘risk premium’ to capital investing outside of London and the south-east.
Although a relatively small part of overall levels of investment, recent data from the West Midlands Growth Company surge in foreign direct investment (FDI), positioning it as a leading region in the UK outside of London. In the 2023/24 financial year, inward investment projects in the WMCA area totalled 70, creating 6,082 jobs. This was significantly higher than other combined authority areas outside London. For Greater Manchester it was 61 and 3,493, for Liverpool 30 and 561, and for the West of England it was 38 and 1,342. However, in an economy of £77 billion, such investment, while important, is a relatively small part of overall investment in the wider economy.
What we can infer from the limited data that exists is that while private investment in the West Midlands is significantly lower than London and the south-east, this is likely to be predominantly a demand-side issue and there is no clear evidence as to whether the West Midlands is significantly worse than other non-London and south-east parts of the UK.
Public investment. Infrastructure spending per capita has been consistently lower in regional cities compared to London. By way of example, for the period 2021-22, public expenditure on transport in the West Midlands was £687 per head, compared to £1,212 in London; and we considered R&D investment in the section above. The public investment figure in the West Midlands includes spending related to the 2022 Commonwealth Games held in Birmingham. Transport connectivity between and within regional cities also lags behind international standards. Changes to patterns of public sector expenditure in the West Midlands region are shown in Table 2 below.
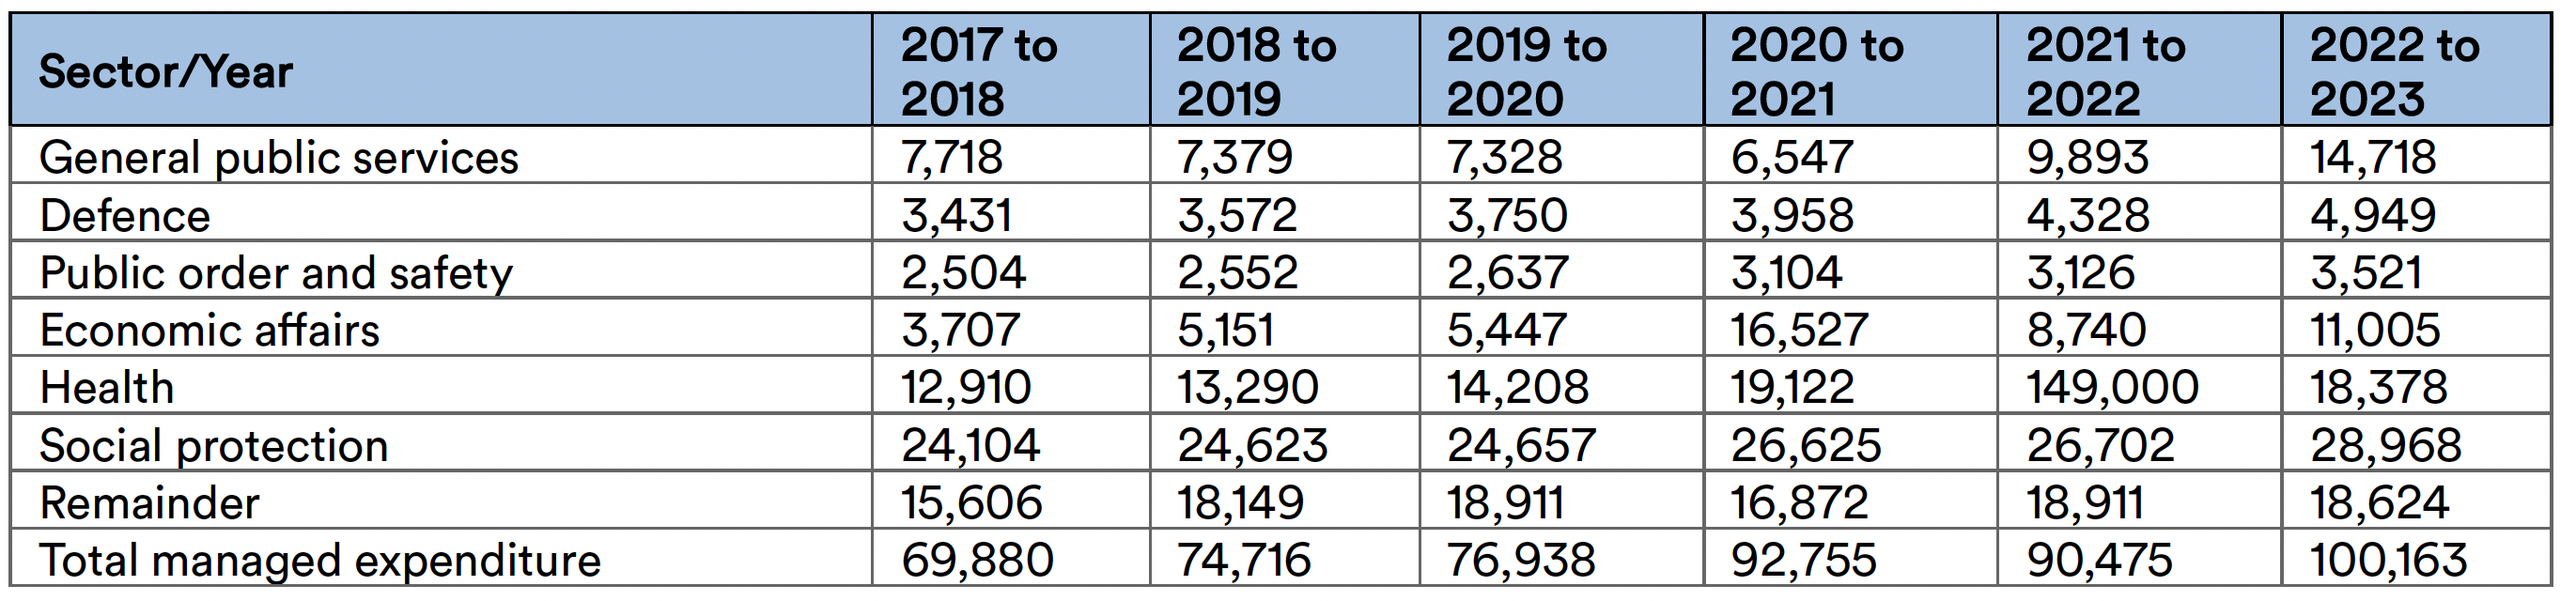
Figure 22: Public sector expenditure in ITL1 West Midlands, 2018-2023, £ million.
There has been a significant increase in public sector expenditure between 2018 and 2023, with health and social protection accounting for the majority (65%) of public investment, similar to other UK regions. (This includes the increase in healthcare and social protection spending in 2020 and 2021 when the Covid-19 pandemic hit the UK). However, capital expenditure shows a less coherent picture, noting increases in transport expenditure across the period but a decline if transport is excluded.
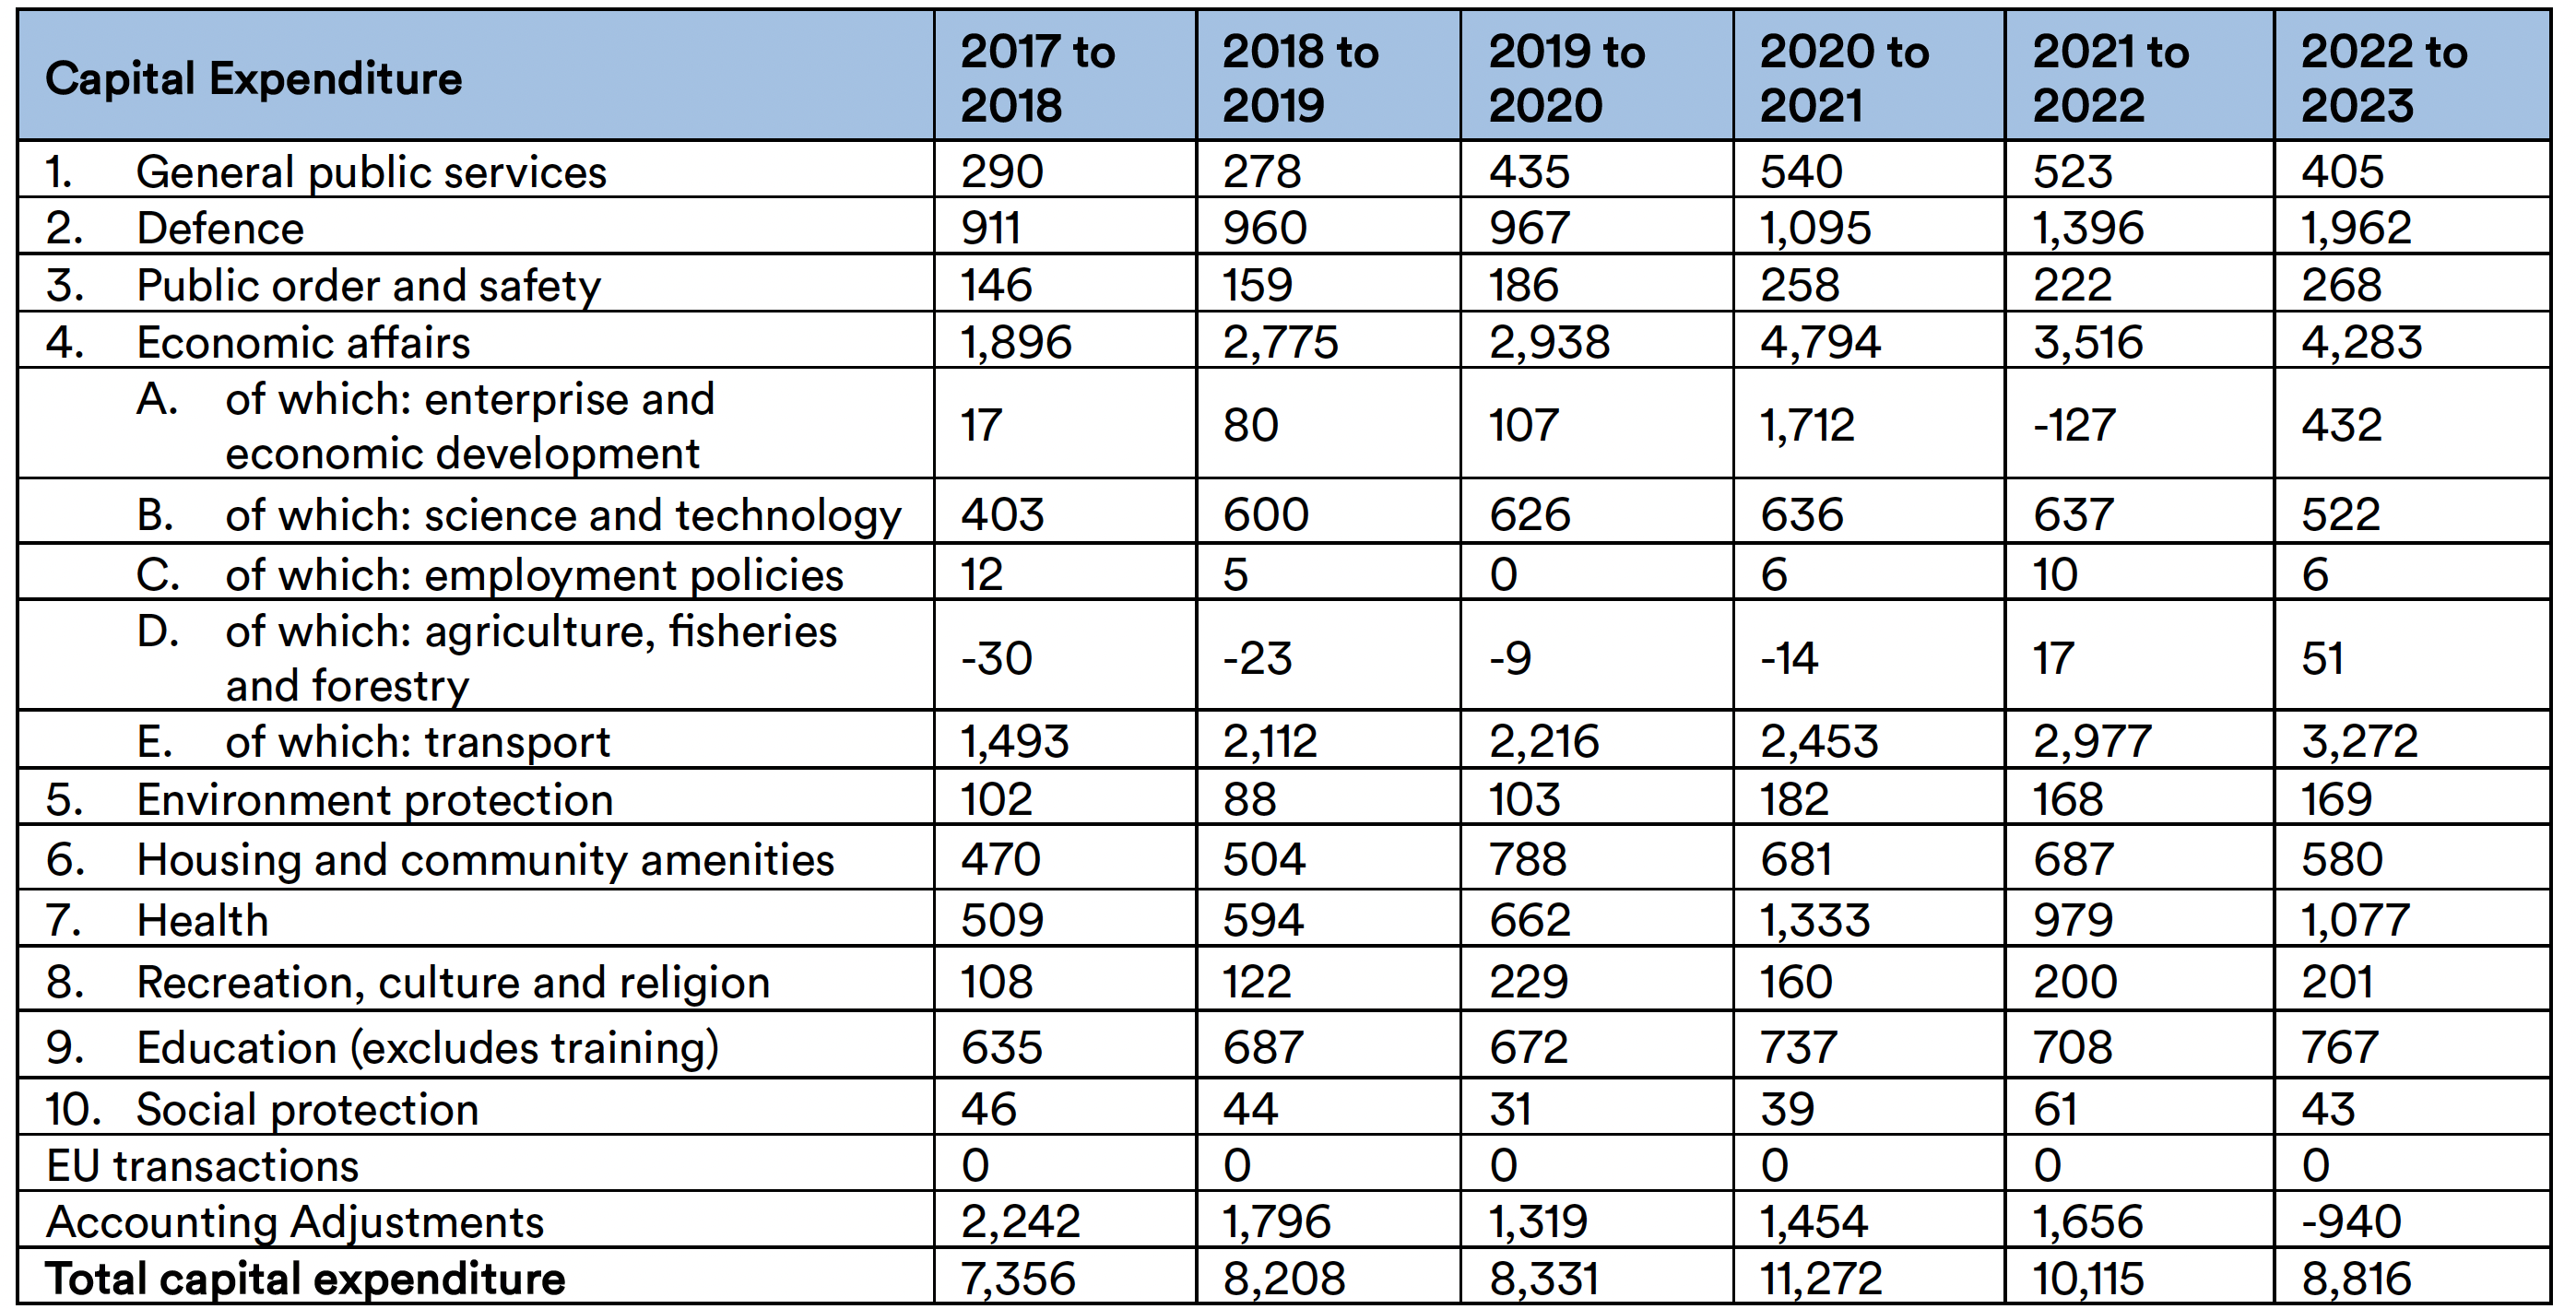
Figure 23: Public sector capital expenditure in ITL1 West Midlands.
Given this data is ITL1 region only, covering the West Midlands region, it is difficult to draw specific conclusions relating to the West Midlands Combined Authority area with further work required to explore the availability and robustness of this data but ITL1 data does begin to suggest that public sector investment in the region is relatively low.
Connection with other sub-systems
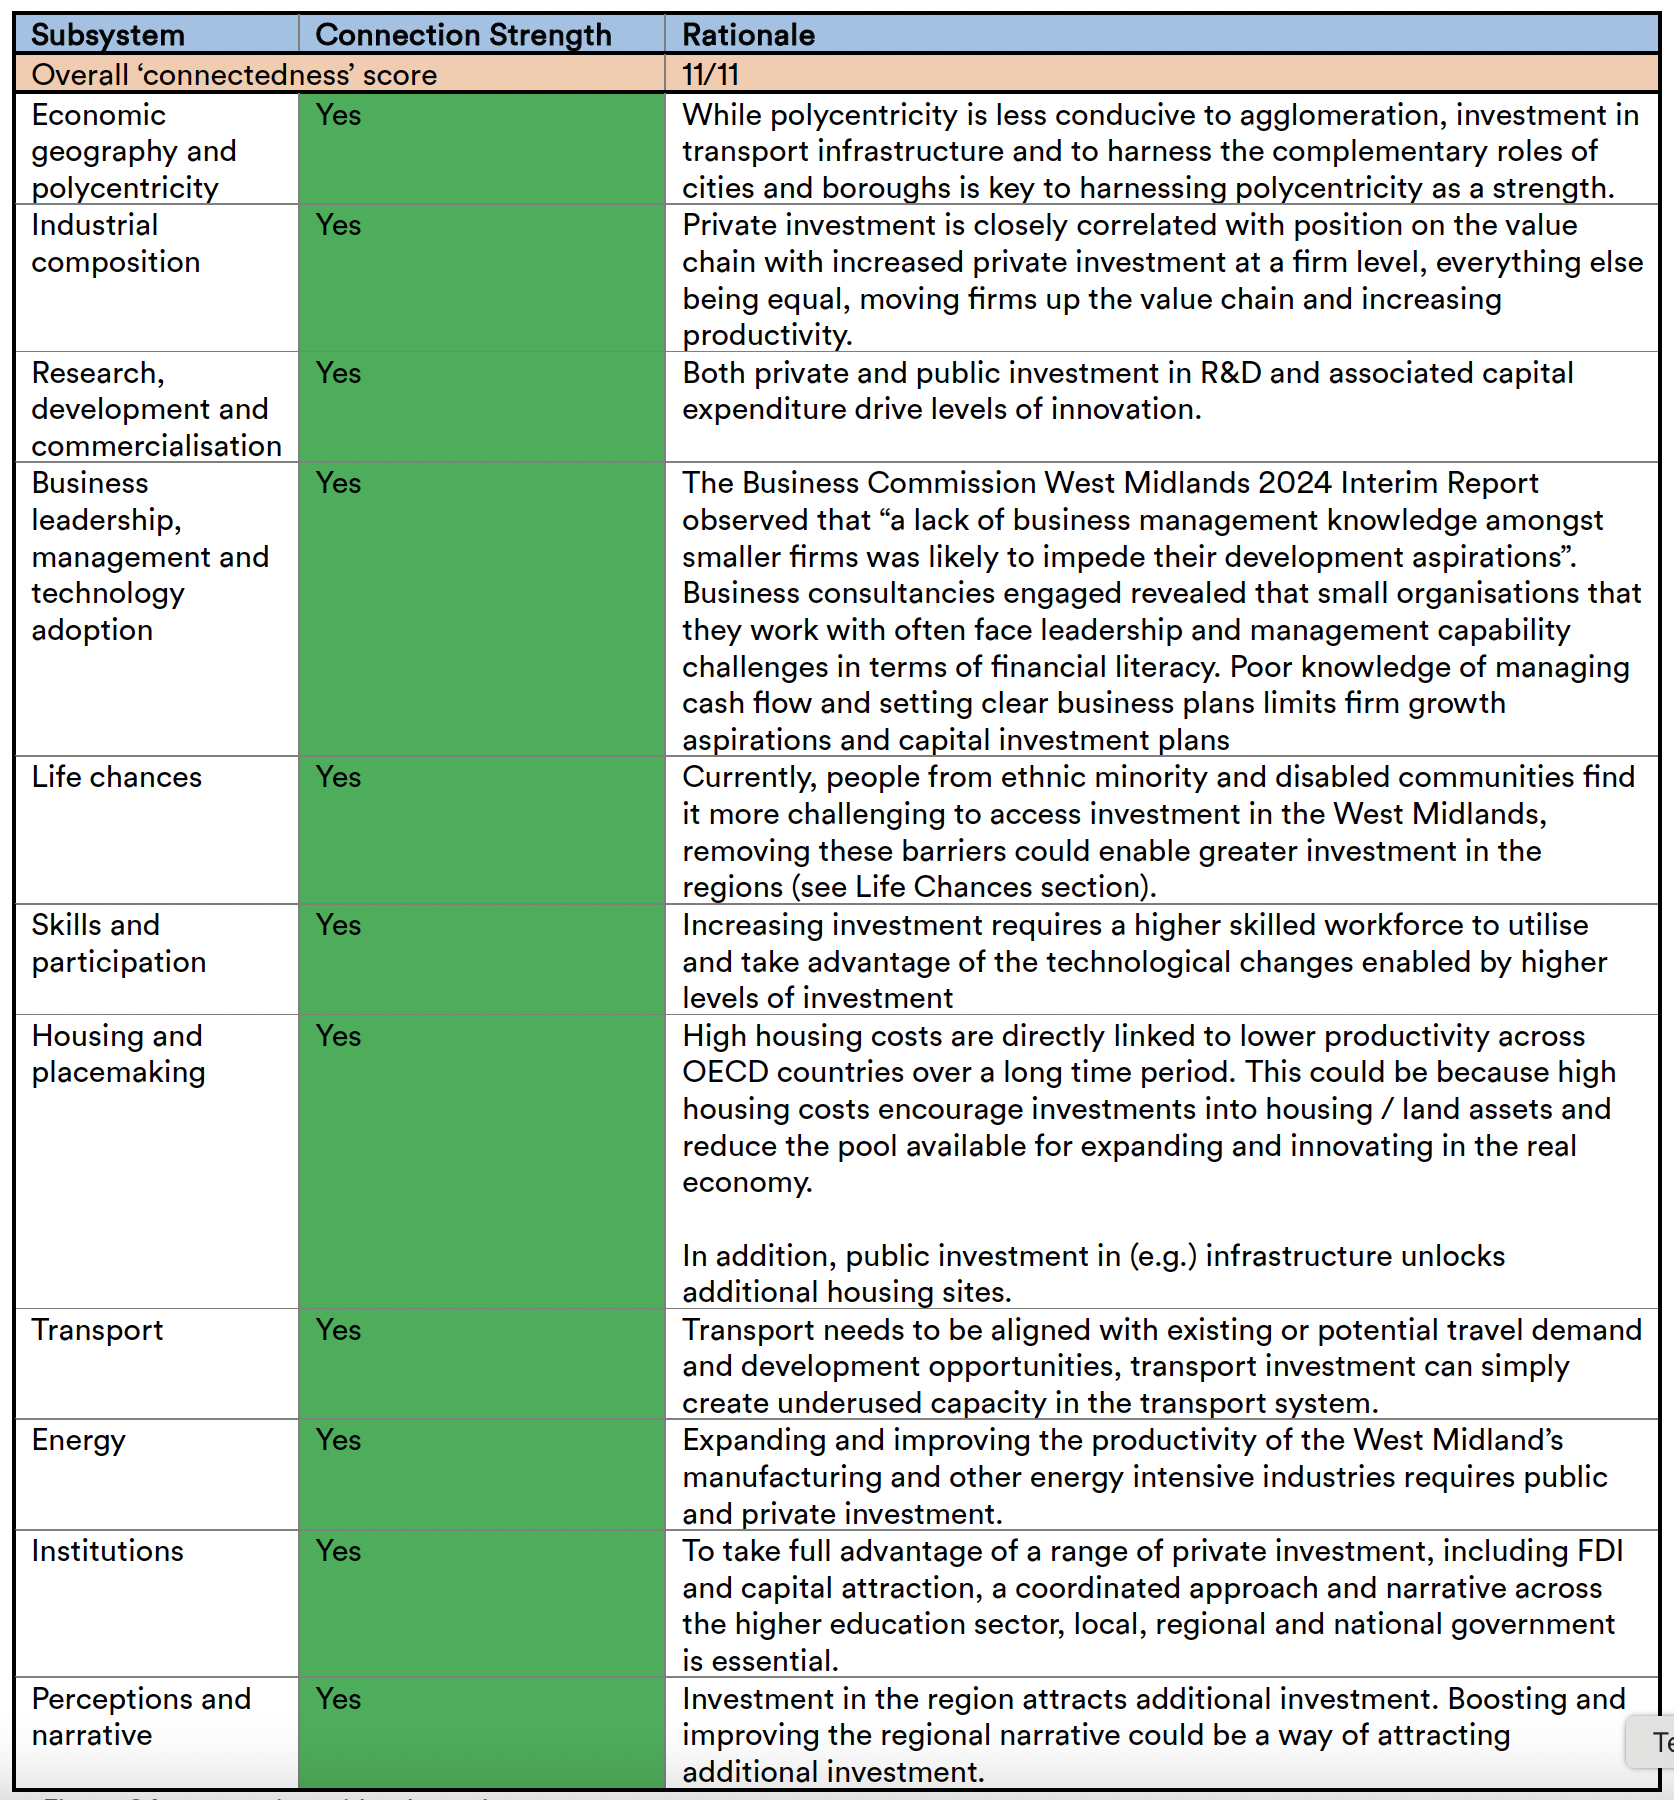
Figure 24: connection with other subsystems.