Page contents
Inclusive Growth in the West Midlands: An Evidence Informed Approach
In the West Midlands Growth Plan, the West Midlands Combined Authority has set out its ambition to grow our regional economy and improve living standards for everyone across the West Midlands.
Traditional models of growth often seek to raise prosperity and living standards for some first, before redistributing the fruits of that growth to others, for example, through better public services. In contrast, the West Midlands have committed to a different model approach, Inclusive Growth, where it matters who creates that growth, where it is created, and who benefits from it. In short, we are pursuing Growth for Everyone.
Our Inclusive Growth Framework helps policymakers navigate this complexity, ensuring that people living, working, and visiting the cities, towns, and villages in our region can all play a role in creating prosperity and raising living standards – all while protecting and enhancing our environment.
It does so by aligning all types of investment – public or private, capital and revenue, time and attention – around a shared set of economic, social, and environmental missions. By focusing on these missions – the eight fundamentals of inclusive growth – we can help policymakers understand how a strategy, programme, policy, or activity might impact on other areas, enabling a systems approach to address complex challenges.
Just as the West Midlands Growth Plan is underpinned by a robust evidence base – the West Midlands Theory of Growth – our Inclusive Growth fundamentals are supported by this evidence base. It sets out the enablers and tensions for each fundamental, helping policymakers across the whole policy cycle: from developing and appraising interventions to evaluating their success. Naturally, there are gaps in this evidence base too, offering opportunities for researchers and practitioners to address these gaps and contribute to our areas of research interests.
Together, we can make the West Midlands the best place to live, work, and visit.
Si Chun Lam
Head of Research, Intelligence, and Inclusive Growth
This report provides essential guidance for policymakers and practitioners across the West Midlands ‘system’, enabling a collective effort to achieve inclusive and sustainable economic growth. By grounding our approach in robust qualitative and quantitative evidence, we can better understand the complex factors that drive prosperity and wellbeing for all our residents, across every city, town, and village.
This report outlines the key enablers and tensions influencing each of our eight inclusive growth fundamentals, offering an analysis of the specific challenges unique to our region. It also highlights the interconnections between these fundamentals, identifying opportunities for collaboration and innovative action across sectors and communities.
Utilising the Inclusive Growth Framework to inform decision-making ensures our strategies and investments are aligned with the needs and aspirations of local people. In strengthening our understanding of the lived experiences of our citizens and communities, we can design and deliver policies that raise living standards, foster resilience, and support the long-term prosperity of our region.
Together, by applying this evidence-based approach, we can drive the transformation required to make the West Midlands a place where everyone can thrive.
Greenhouse gas emissions fell by 18% between 2017 and 2022 in the WMCA area, a slightly faster rate than the 15% fall for all of England. This is a priority for our residents, with 61% of those surveyed in 2023 reporting that they had been worried about the impact of climate change over the previous 12 months. The price of not meeting the challenge on climate change is high, with a high emissions projection estimating that temperatures in Central England could reach 5.8 oC higher in 2060-2079 than in 1981-2000. In economic terms, it is estimated that climate change could reduce GVA in the WMCA area by £1.5bn-£2.9bn (around 1.5%-2.9%) a year by 2050.
Domestic energy consumption is generally higher in the WMCA area than the national average, likely due to factors such as variation in energy efficiency of housing, and cold temperatures. An estimated 17.9% of residents were living in fuel poverty in 2023, making it a priority to increase the energy efficiency of homes to reduce the burden of heating costs. Not only is there a clear benefit for residents financially, but domestic emissions also contribute an estimated 100 million tonnes per year in England, with gas heating largely to blame. The WMCA estimates that their goal of retrofitting a million homes by 2041 would reduce our contribution to this by around 4 million tonnes.
There has been a significant reduction in the proportion of waste sent to the landfill in England, with a sharp fall from 30.9% in 2013/14 to 5.5% in 2023/24, due to various changes including an increase in recycling, alternative methods of disposal due to the landfill tax, and improved product design reducing wastage. In the WMCA area, an even lower proportion of waste goes to the landfill, at 3.6%. This is important because landfills are harmful to the environment and health of local communities. Whilst our traditional economic system has been quite linear, with resources harvested, refined, consumed and discarded, designing a circular economy where resources are reused reduces demand, extends value and reduces emissions.
The estimated almost 5 million trees in the WMCA area capture around 57,620 tonnes of CO2 every year, with their contribution to our environment having an estimated value of nearly £75m. In addition to environmental benefits, access to green spaces is associated with improved mental health and increased life expectancy. The health benefits of living with a view of a green space are worth up to £300 per person per year, with close proximity to a park increasing a property’s value by an estimated 9.5%. Our green spaces not only absorb CO2, but they can also serve as drainage systems, providing a significant reduction to the level of surface water pollution. The summer floods of 2007 cost an estimated £3.2bn, highlighting the value to the economy.
Traditional economic measures often focus on the growth in Gross Domestic Product (GDP) and Gross Value Added (GVA) to measure the health of the economy. Unfortunately, even when these measures are increasing, growth is not equally distributed. Research has found that economic growth did little to reduce poverty between 2000-2008, with top earners seeing their wages increase but those in the bottom half of earners seeing little change. Between 2008-2022 the gap between high and middle earners widened whilst the gap between middle and low earners narrowed, meaning that whilst inequality has reduced, the top earners have increased their share at a higher rate. The higher rate of inequality in the UK compared to 23 OECD countries cost the country approximately £106.2bn in 2023 in health and crime alone. American Research has found that eliminating wealth inequality increases consumer spending and economic participation, improving living standards and increasing economic stability.
Inequality in economic activity and employment based on gender and ethnicity result in worse outcomes for less privileged groups, ultimately harming the economy. The WMCA area also has a larger than average proportion of economically inactive residents who are on long term sick, with 30.5% of those inactive in this category compared to 26.3% nationally, making this a priority group to support. Young people are another group requiring support, with 16.3% of 16–24-year-olds unemployed in the WMCA area, compared to 11.8% in Greater Manchester. Research has found that each month of unemployment between 18 and 20 reduces a person’s income by around 1.2% permanently, representing the scarring effect on young people.
Business birth rates fell by around 13% in England in between 2021-23, but they fell by 23% in the West Midlands region. Not only are less businesses being created, but the West Midlands region also has the worst 5-year business survival rate in the UK, with only 34.7% of those created in 2018 still operating in 2023. Whilst the wider economy has suffered from the impact of the COVID-19 pandemic in recent years, another prominent challenge for the region is in workforce skills, with 35% of vacancies considered hard-to-fill in 2022 due to skills shortages.
Turnout at elections is the most common traditional measure of participation, as it gives residents the opportunity to choose who represents them. In the 2024 general election, only 57.3% of eligible voters cast their ballot in the West Midlands region, less than the 59.7% nationally. The turnout in local elections is lower, with only 29.8% voting in the 2024 mayoral election in the WMCA area, showing the different level of engagement residents have with us.
Only 25% of residents in the WMCA area felt that they could personally influence decisions affecting their local area in 2023/24, but only 29% agreed that they would like to be more involved in decisions made by their council. Residents in our area were also less likely to report any civic participation in the previous 12 months than nationally, with only 29% compared to 33%, but volunteering represented a much more common method of engagement, at 51%. Research shows that volunteers report higher levels of community identification and social support, but only 28% of WMCA residents trust many of their neighbours, much less than the 41% English average.
A survey from the LGA in 2021/22 found that only 16% of residents in the West Midlands region reported trust in the national government to make decisions about services in their local area, with a far higher 71% trusting their local council. Measuring trust is challenging, relying on surveys which often have small sample sizes, and so further research could help increase our understanding of why residents feel this way.
The West Midlands region had one of the highest proportions of homes that are non-decent in 2023 at 16.1%, with 25.4% of privately rented homes in this category. Homes in the WMCA area were more likely to be overcrowded in 2021, with 7.8% of homes, 1.4pp more than the English average, with ethnic minorities more likely to be impacted. Living in an overcrowded home is associated with worse mental health, with children also struggling to find space to study and complete homework. Around 1.5 million children in England lived in non-decent homes in 2022-23, with around 1 million of those living in hazardous homes, and nearly 800,000 living with damp. The median cost per household to rectify these issues was lowest in the West Midlands region, at £6,408.
Damp in a child’s bedroom is associated with respiratory problems, a situation that is more likely in homes living in fuel poverty as damp can be exacerbated by restricted heating. The increased risk of mould in these homes presents an additional cost to rectify, and a health challenge for those who are already living in poverty.
In 2023/24, 17,310 households in the WMCA area were assessed as being due a homelessness duty, with ethnic minorities more likely to be impacted. At the end of March 2024, there were 6,520 households living in temporary accommodation, with 5,537 including children. Local authority and housing association stock only housed 40% of these households, highlighting that the supply cannot meet the demand. Shelter estimated that local councils spent £2.3bn in 2023/24 on providing temporary accommodation. Hospital records show that the median age of death for people rough sleeping in England was 20 years younger than non-rough sleepers admitted who were in the most deprive quintile. The ratio of house prices to earnings increased from 5.72 to 7.1 in the West Midlands region between 2013 and 2023, increasing the financial pressure on residents.
The level of crime rose in the WMCA area in many categories between May 2020 and December 2024, including violent crime, shoplifting, possession of weapons and public order offences. Anti-social behaviour fell from 8,340 to 1,992 between December 2010 and December 2024. It can be challenging to draw interpretations from these figures, as a reduction can reflect reporting differences rather than reduction in crime. Residents who feel safe in their community tend to walk more, which is beneficial for both their health and the environment.
53.1% of drivers surveyed in the WMCA area reported that they would find it difficult to work without access to a private vehicle. This is a large proportion, but it was the lowest of any metropolitan area outside of London. The most common difficulty reported by residents using public transport or active travel to commute in 2022 was quality. Around 11.9% of residents in the West Midlands region live in transport poverty. As cars are the most expensive mode of transport, affordable and high-quality public transport is a priority for those in poverty. Households in the top 3 income quintiles have similar levels of car ownership but the level drops considerably for the fourth and fifth quintiles. TfWM reported that residents with cars could access more than double the job opportunities within 45 minutes than those without a car. 1 in 4 households in the West Midlands don’t have access to a car, limiting their employment opportunities. In England, those with mobility issues were more likely to choose the bus than rail but still made 38% fewer trips than those without mobility issues. Reasons cited for low train use amongst this group include distance to stations, platform design, unclear signage and announcements, and difficulty boarding and using seating.
In 2018, it was estimated that 29% of all energy consumption in the WMCA area came from transport. Cars contributed around 57% of greenhouse gas emissions from road transport in 2021, highlighting the importance for environmentally friendly alternatives. The University of Birmingham estimated that improving air quality in the region to meet WHO guidelines could save as much as £3.2bn over 20 years due to improved health outcomes. Active travel presents an alternative, but the proportion of adults walking or cycling at least 5 times a week fell from 29.6% in 2019 to 26.8% in 2020. Since the COVID-19 pandemic, this figure has remained reduced. It is estimated that if all regions in England walked and cycled as much as the most active region, around 1,800 early deaths a year would be prevented.
Access to digital connectivity is of ever-increasing importance. The Lloyds Consumer Digital Index found in 2024 that the proportion of those digitally excluded had fallen to 3% nationally. Digital exclusion limits residents’ ability to access cheaper goods and services, costing an estimated £478 per year on average. It also presents a barrier in applying to jobs and accessing educational resources and courses. There are a range of causes of digital exclusion, including cost of devices and broadband, lack of digital skills, and data privacy concerns. Research in 2022 found that every pound invested in building digital skills of excluded people returned £9.48, worth an estimated £12.2bn nationally.
The WMCA area has the lowest proportion of working age residents with a level 3 qualification. Despite this, the proportion of vacancies due to a lack of skills, qualifications and experience was lower than the national average. The gap between the rate of pupils on free school meals and their peers progressing on to higher education in the West Midlands has widened and is now at its widest since before 2009 when the earliest data is available. Analysis of OECD countries found that the rate of university education had the strongest influence on life expectancy in a country, highlighting the importance of this.
Apprenticeship starts have fallen at a faster rate than the national average. Level 3 apprenticeships particularly benefit young men, providing earnings more than 40% higher than those who studied an equivalent classroom-based qualification at the age of 23. Degree apprenticeships have fared better, but only 5% of students on these courses were eligible for free school meals, compared to 17% for regular degrees, and the completion rate was only 55%, far less than the 89% of traditional degrees.
Pupils in the region miss more school and are less likely to achieve the required standard in their Maths and English GCSEs than the rest of England. There was a considerable variation in achievement by ethnicity, and by SEN status. This data can help inform where adult education programmes can have the largest impact in the future.
The rate of young people who are NEET is slightly higher in the WMCA area than the national average. Research found that each month of unemployment between the ages of 18 and 20 results in a permanent income loss of 1.2% per year but when workers reach 24, any unemployment does not have a visible impact.
The inequality in life expectancy in the West Midlands region was 10.5 years for males and 8.5 years for females between 2021 and 2023. Research has also shown that the more deprived a background a child or young person comes from, the more likely they are to received emergency admissions for conditions including asthma and diabetes. Another research study also found that someone dies every 10 minutes in England due to inequality, with a total loss of life expectancy of 3.3 years for those aged under 75.
Analysis by the ONS found that self-reported health, marital status (with those married or in a civil partnership better off) and employment status were the largest contributors to life satisfaction. Between 2017 and 2023, there was a sharp rise in estimates of mental health conditions amongst 17- to 19-year-olds, with an increase in child mental health services demand of 50%. Demand on adult mental health services has also risen across England. A major cause of this is loneliness, making a person 2.25 times more likely to have a depression diagnosis. In 2022, those reporting mental health issues were estimated to have a 17.15% lower salary on average.
Smoking remains the largest preventable cause of cancer in England, with an estimated 12% of adults smoking in the West Midlands region in 2023. Despite this, the proportion of smokers quitting for 4 weeks or more has fallen sharply from 4.4% in 2013/14 to 0.9% in 2022/23. Research published in 2024 estimated the cost of smoking to the NHS to be £1.9bn, with £21.8bn lost in reduced productivity. Estimates show that men living in the most polluted neighbourhoods outside of London will live 3.5 years less, with women living 2.5 years less. Obesity presents another public health issue, costing the NHS an estimated £6.5bn per year. The level of obesity in the UK more than doubled between 1993 and 2022, and obesity in children significantly increases their risk of developing type 2 diabetes and cardiovascular diseases in later life.
Different societal groups in the WMCA area have varied experiences of pay and employment. In the West Midlands region, there was an estimated race pay gap of 9.5% in 2022, disability pay gap of 17.7% in 2023, and gender pay gap of 12% in 2024. Unemployment rates varied by ethnicity in the WMCA area, at 4.5% for White residents compared to 10.7% for Black residents in September 2024. Only 3.7% of employed ethnic minorities in the WMCA area were working in managerial or senior official occupations in March 2024, compared to 8.7% nationally.
Women are more likely than men to work part time, be employed on zero hours contracts, and be classed as low earners. In the WMCA area the lower economic activity rate of women resulted in a loss of 8.35% of GVA in 2023. Childcare costs in the UK were the second highest in the OECD in 2022, costing around one in three parents of pre-school children a third of their wages.
The unemployment rate of disabled residents in the WMCA area is almost double that of non-disabled residents. There is an even larger inequality in rates of economic inactivity, at 47.2% for disabled residents compared to 18.4%, contributing to increased levels of poverty amongst disabled people in the UK. There is an estimated ‘Disability Price Tag’ of £1,010 per month in the UK in 2023 for a disabled household to achieve the same standard of living as a non-disabled household. Disabled residents in the WMCA area with mobility issues also have less choice in homes, with an estimated 28% of housing unable to meet accessibility standards.
White British residents in Britain spent the lowest proportion of their income on housing in 2021/22-2022/23 at 11%, compared to Arab residents who spent the highest at 26%. Ethnic minority households are also more likely to not have access to a car or van than White households, with 34% of mixed ethnicity residents compared to 16% of White residents.
The WMCA defines Inclusive Growth as ‘a more deliberate and socially purposeful model of economic growth - measured not only by how fast or aggressive it is; but also, by how well it is created and shared across the whole population and place, and by the social and environmental outcomes it realises for our people’. The Inclusive Growth Framework has been at the core of the WMCA’s work since it was approved by the WMCA board in September 2018. Since then, it has shaped the development of strategy and policy to ensure that we deliver economic growth in a sustainable way that benefits all of our residents.
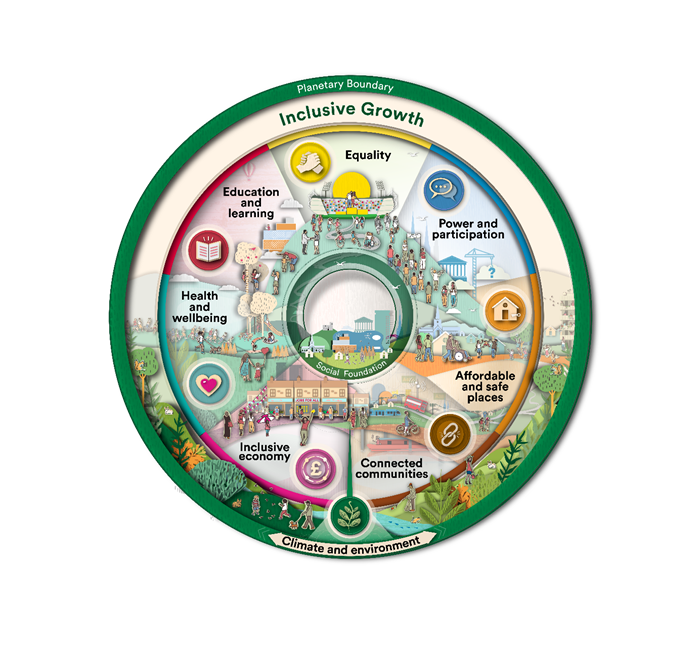
Figure 1: A circular infographic illustrating the concept of inclusive growth, with an outer ring representing the planetary boundary and climate and environment fundamental, and an inner ring representing the seven social foundation fundamentals
The framework consists of 8 fundamentals: climate and environment, which focuses on our role in minimising climate change and other environmental impacts in everything we do, and 7 human-focused fundamentals, representing a range of equally important priorities to our residents. Although we recognise 8 individual fundamentals, the message that they are interconnected is central to the purpose of the framework.
Our use of traditional measures of economic growth such as GDP are important, but they only capture part of the picture. We must also understand who is creating economic growth, how that growth is distributed amongst our residents and the progress we are making to improving social and environmental outcomes in our region. Through the lens of inclusive growth, we can ensure that we are incorporating these issues into our decision-making, making our policy more informed and effective.
The funding landscape has often led to narrow and focused policy making that has encouraged competition and trade-offs. The Inclusive Growth approach emphasises that peoples’ experiences of the economy are complex and so encourages policy makers to broaden considerations to all eight of the fundamentals when designing policy. Whilst the Inclusive Growth framework provides us with a basis to track our impact, we must also understand the challenges that our region faces within each fundamental and how these influence our residents.
Breaking down each fundamental into defined scopes allows us to consider the key issues and measure their impact. By harnessing the data available to us we can identify where barriers are most profound for our residents, which can aid us in determining our priorities. Combining these insights with research not only develops our understanding of people’s lived experiences, but it also provides us with the evidence we need to make effective decisions and develop strategies that capture the complexity of our economy.
For each fundamental of inclusive growth, colleagues within the WMCA were asked to provide sources of research and analysis that could form part of this evidence base. The sources provided were then collated and informed the content of this document where they could provide relevant insights. Sources which provided information about the WMCA area, or the wider West Midlands region were prioritised; where research or data was not available at either of these levels, more general national level data was used to address any gaps in content. Secondary analysis was used in producing the figures for this document, from a range of sources including government statistical publications, reports and datasets, along with other public sector and charity commissioned reports.
The content for each section was written with the aim of providing a wide coverage of each inclusive growth fundamental’s scopes. Each section contains a range of more traditional and wider measures, with a narrative of what they tell us about the challenges and opportunities we have in the West Midlands.
Climate and Environment is the capacity to which our social and economic ecosystems can cope with the multiple risks, uncertainty and threats posed by climate change. We must change our social and economic ecosystems to ensure we work within the planet’s limits and make adaptations which increase our ability to cope with the risks, uncertainties, and threats associated with climate change. The pursuit of continuous growth is not sustainable if we use up natural resources faster than the Earth can renew them.
Economic prosperity and the condition of the natural environment are intrinsically linked. Unlocking investment for the environment and nature-based solutions will support WMCA in delivering its ambition of a region which is fairer, greener, healthier, better connected, and more prosperous.
The level of greenhouse gas emissions is commonly measured to understand our contribution to climate change. In 2022, an estimated 291 Megatonnes (Mt) of emissions were generated in England, with around 32Mt of these generated in the West Midlands region.[1] Emissions from the WMCA area totalled around 11Mt. Although the emissions per capita for the WMCA are only around two thirds of that for the wider region, the emissions per km2 were five times as much, which demonstrates how differently emissions are distributed in metropolitan areas. Compared to 2017, the 11Mt for the WMCA area represents a decrease of approximately 18%, slightly more than the national decrease of 15%.
[1] Department for Energy Security and Net Zero, “UK Local Authority and Regional Greenhouse Gas Emissions Statistics: 2005 to 2022”
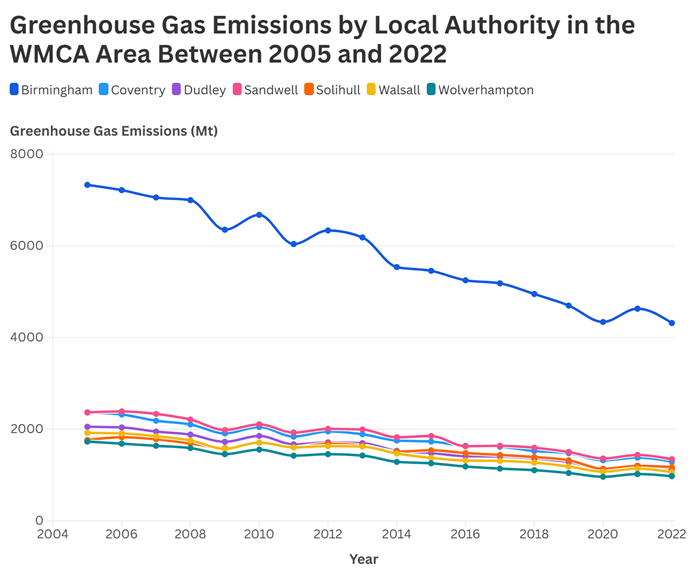
Figure 2: A line graph showing a trend of reducing greenhouse gas emissions by local authority in the WMCA between 2005 and 2022
Climate change is an important issue to residents in the West Midlands region, with around 61% in 2023 reporting that they had been worried about the impact of climate change over the previous 12 months though this is a slightly lower level than the 64% in England.[1] In recent years there has been a visible impact on weather conditions in the West Midlands and wider society attributable to climate change. There has been an increased frequency and severity of heatwaves, which pose a health threat to those who are vulnerable. Research in Dudley has shown a trend of increasing heatwaves between 2012 and 2022, along with a similar pattern of increased excess deaths.[2] Excess deaths related to heatwaves have been found to be more focused in urban areas, suggesting that areas within Birmingham, Coventry and parts of the Black Country are more likely to be impacted.[3] The WMCA’s Climate Risk and Vulnerability Assessment shows that those in more deprived, urban areas are more vulnerable to the impact of climate change in the West Midlands.[4]
UK Climate Change Projections from 2018 show that even if emissions are brought to a low level, a summer in central England between 2060-2079 could be as much as 3.3 oC warmer than between 1981-2000.[5] A high emissions scenario could see temperatures rise as much as 5.8 oC, highlighting the importance of lowering emissions to limit the risks these rises present. A summary of climate change impacts in the West Midlands reports that an absolute best-case scenario could still see a 2.3 oC rise in summer temperatures, along with wetter winters, drier summers and increased humidity throughout the year.[6] This demonstrates the scale of temperature increases and the risks that increased heat presents to human life as well as to critical infrastructure and the natural environment. The 2022 summer heatwaves brought 125 faults to National Grid’s power distribution in the West Midlands, affecting 46,225 customers.[7] Storm Darragh in December 2024 brought significant disruption to transport in the West Midlands, with rail services suspended between Walsall and Wolverhampton due to obstructions on the line and an estimated 200 trees falling down in Birmingham alone.[8]
To minimise further climate change, the WMCA declared a climate emergency in 2019 and has committed to making the West Midlands net zero by 2041, meaning that CO2 emissions produced in the region must be reduced to a level where they are balanced by emissions removal.[9] This requires both reducing emissions and increasing our capacity to remove emissions from the atmosphere.[10] To reduce the impacts of climate change, the WMCA is committed to climate adaptation - making adjustments to the way we do things so that our region is climate resilient. Climate resilience means our communities, infrastructure and natural environment can withstand, cope with and bounce back from the impacts of a changing climate. The economic impact of failing to do this for the West Midlands would be severe, with climate change projected to reduce GVA by £1.5bn-£2.9bn (around 1.5%-2.9%) per year by 2050 due to factors including increased damage from flooding, decreased water availability and the impact of increased heat.[11]
[1] Office for National Statistics, “Climate Change Insights, Families and Households”
[2] Dudley Metropolitan Borough Council, “Heatwave Briefing: November 2022”
[3] Gasparrini, et al. “Temperature-Related Mortality Risks in England”
[4] West Midlands Combined Authority, “Climate Risk and Vulnerability Assessment (CRVA)”
[5] Met Office, “UKCP18 Infographic: Headline Findings – Land”
[6] West Midlands Combined Authority, “Summary of Climate Change Impacts in WMCA Area”
[7] West Midlands Combined Authority, “Economic Impacts Assessment Executive Summary”
[8] Majid Mahmood, “We’ve published our climate adaptation strategy for the West Midlands”
[9] West Midlands Combined Authority, “Environment and Energy”
[10] National Grid, “What Is Net Zero?”
[11] West Midlands Combined Authority, “Economic Impacts Assessment Executive Summary”
The median consumption of domestic gas in England in 2023 was around 9,900kWh.[1] Other than Coventry, which was around the same, all local authorities in the WMCA area had a median consumption rate above the national average. Multiple factors influence the rate of consumption in different areas, including the energy efficiency of housing, and variance in cold temperatures.
[2] This is likely to be behind the higher levels recorded in the WMCA area.
[1] Department for Energy Security and Net Zero, “Regional and Local Authority Gas Consumption Statistics.”
[2] Mashhoodi, “Who is more dependent on gas consumption? Income, gender, age, and urbanity impacts”
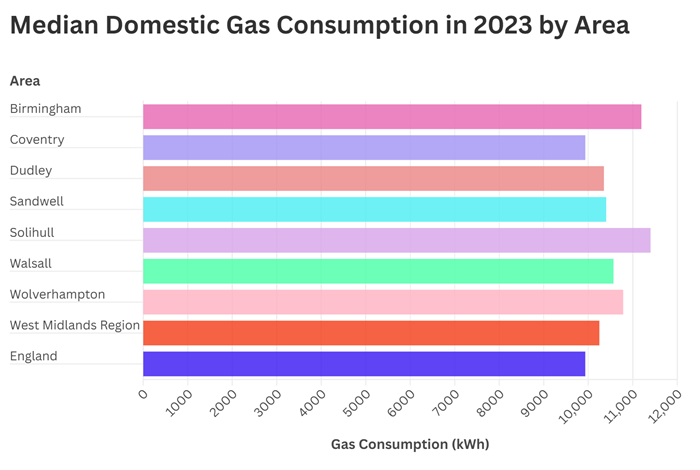
Figure 3: A bar chart comparing the median domestic gas consumption of local authorities in WMCA to the West Midlands region and England in 2023, with only Coventry’s figure below the regional and national average
A large amount of CO2 emissions is generated domestically, with an estimated 100 million tonnes emitted each year in England, averaging around 4 tonnes per household.[1] Gas heating makes a significant contribution to this. To address this issue, the WMCA has committed to retrofitting over one million homes in the region by 2041, with the outcome being an estimated reduction of more than 4 million tonnes of emissions.[2] Not only are there clear environmental benefits from this, the increased energy efficiency will reduce energy bills, providing much needed financial relief for those living in fuel poverty, which 17.9% of households in the WMCA area experienced in 2023.[3] The WMCA estimates that its current retrofit programmes can deliver fuel savings of £91m per year for residents. Further benefits include the creation of 6,000 skilled jobs and an increase of £10.8bn in GDP.[4] These interventions can maximise the benefits to the environment, skills in the workforce, and improve living standards for residents.
[1] Department for Levelling Up, Housing and Communities, “English Housing Survey: 2022 to 2023 Energy Report”
[2] West Midlands Combined Authority, “West Midlands Levelling Up Growth Prospectus: Section A – Going Further, Faster – Retrofit”
[3] UK Department for Energy Security and Net Zero, “Fuel Poverty Detailed Tables 2025 (2023 Data)”
[4] West Midlands Combined Authority, “West Midlands Levelling Up Growth Prospectus: Section A – Going Further, Faster – Retrofit”
In 2023/24, around 5.5% of all Local Authority collected waste in England was sent to the landfill.[1] This is a significant reduction on the rate of 30.9% in 2013/14. The rate was lower in the West Midlands region, at 4%, and even lower in the WMCA area, at 3.6%. The large reduction in waste going to landfill in recent years is down to various factors, including increased uptake in recycling, moves to alternative disposal methods in response to the landfill tax, and improved product design.[2] The landfill tax is an additional charge to businesses who dispose waste using landfills, with the cost determined by the weight of the waste.[3] Landfills are harmful to both the environment and the health of communities, producing both greenhouse gas emissions and other emissions which can be toxic to humans.[4]
[1] Department for Environment, Food & Rural Affairs, “Local Authority Collected Waste Management – Annual Results”
[2] Slorach et al, “Assessing the economic and environmental sustainability of household food waste management in the UK: Current situation and future scenarios”; Waste Managed, “UK Landfill Impact Guide 2025”
[3] UK Government, "Landfill Tax"
[4] Dirk, "Environmental and Socio-Economic Impacts of Landfills"
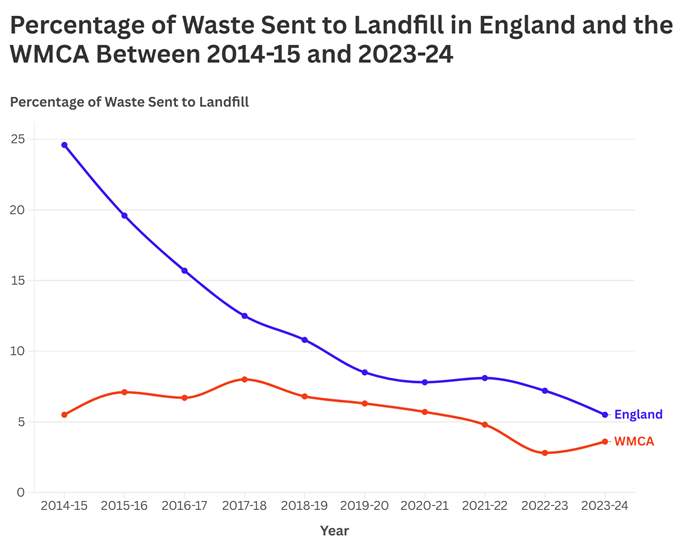
Figure 4: A line graph showing the percentage of waste sent to landfill in England and the WMCA between 2014-15 and 2023-24, with WMCA consistently sending less than the national average
Whilst gas heating is a key contributor to CO2 emissions in the West Midlands, a significant amount can also be attributed to the linear design of our economy, where resources are utilised in an unsustainable manner. In our current economic system, a large amount of resources are used to create products which are then used and discarded, becoming waste.[1] Designing a circular economy where we reuse resources, reduces the demand for new resources and extends the value of resources which would otherwise be disposed of or combusted and increase emissions. The WMCA estimated in 2022 that engaging 200 businesses a year in a waste management programme could reduce carbon emissions by 14,000 tonnes a year and increase GVA by £1.8m.[2] The potential benefits are large, with an estimated 45% reduction in greenhouse gas emissions generated through manufacturing possible with more circular processes.[3]
Policymakers should consider where their work can contribute to developing a circular economy – with particular focus on reducing the amount of waste that goes to landfill. Working with businesses in the local area to identify processes that can be made more sustainable through increased recycling and waste disposal could be key to reducing the environmental impact of our waste, improve our residents’ health and improve the local economy.
[1] Ellen MacArthur Foundation, "What Is the Linear Economy?"
[2] West Midlands Combined Authority, “Circular Economy Routemap 2024”
[3] West Midlands Combined Authority, “Circular Economy Routemap 2024”
Reducing emissions is a significant priority for the region to reduce our impact on the environment, and the benefits of this can be improved through increasing our capacity to absorb CO2 from the atmosphere. Trees provide a large contribution to this, with the estimated 4,918,000 trees in the WMCA area capturing around 57,620 tonnes of CO2 every year.[1] The economic benefits of our ecosystem’s contribution to the environment are estimated to be worth around £73,446,000 a year. This contribution includes reducing air pollution which is detrimental to our residents’ health.
Access to green spaces is associated with improved mental health and increased life expectancy, although other factors influence this as those living in deprived areas are also likely to have poorer access to these spaces.[2] The health benefits of living with a view of green space are worth up to £300 per person per year, another example of the strong relationship between our environment and our health.[3] It is also estimated that close proximity to a park increases a property’s value by 9.5%.[4]
A biodiversity net gain of 10% is mandatory for developers in England, meaning that the amount and quality of natural habitats are improved after a development.[5] This is crucial to sustain eco-systems in our region, and to maintain the quality of our natural environment. Our green spaces not only absorb CO2, they can also serve as nature-based solutions to our changing climate, such as nature-based sustainable drainage systems (NbSuDS). These can provide a significant reduction to the level of surface water pollution and mitigate the impact of flooding. 13 lives were lost during the summer floods of 2007, with two thirds of the flooding attributed to surface water, and an estimated cost of £3.2bn.[6]
[1] West Midlands Combined Authority, “Valuing the West Midland’s Urban Forest”
[2] Health Foundation, "Relationship Between Access to Green Space and Health"
[3] West Midlands Combined Authority, “West Midlands Natural Environment Plan 2021–2026: Access to Green and Blue Spaces”
[4] UK Green Building Council, “Nature-Based Solutions to the Climate Emergency”
[5] Environment Act, 2021, c.30 (UK): section 98, para. 2.3.
[6] West Midlands Combined Authority, “Nature Based SuDS Guidance Document”
The impacts of climate change are not only felt in our environment and through weather patterns. Air pollution in the form of particulate matter is produced by carbon emitting processes such as car engines and domestic combustion, damaging both the environment and human health.[1] Of particular concern are particulate matter with a diameter of less than 2.5 microns, referred to as PM2.5.[2] The amount of PM2.5 pollution is measured at various sites in the UK, a few of which are located in the WMCA area. Urban sites located in Birmingham Ladywood and Coventry Allesley did not record any levels of moderate or high pollution for any hours in 2023, a considerable improvement from a total of 414 hours in 2019 at the two sites.[3] A roadside monitor on the A4540 in Birmingham also did not record any moderate or high pollution in 2023, a level it has now maintained for 3 consecutive years.
Exposure to PM2.5 is associated with increased deaths from cardiovascular disease, along with deaths related to hypertension and diabetes.[4] Research by the University of Birmingham has shown that up to 2,300 people die early due to long term exposure to air pollution every year in the West Midlands.[5] The scale of this impact is large, with a study in 2018 forecasting a cost of £5.56bn to the NHS between 2017 and 2025 due to around 1.15m cases of disease linked to air pollution.[6] The article also acknowledges that this figure would be higher if including diseases for which there is less robust evidence finding a link to air pollution. To reduce the levels of PM2.5 generated, the West Midlands is working to reduce domestic solid fuel combustion, which research suggests would reduce the level of PM2.5 by 13.4%.[7] The same research found that a reduction in road transport and agriculture emissions at a national level would reduce PM2.5 by 29%.
[1] United Nations Environment Programme, “Air Pollution and Climate Change: Two Sides of the Same Coin”
[2] Yang et al., “Trends on PM2.5 Research, 1997–2016: A Bibliometric Study”
[3] Department for Environment, Food & Rural Affairs, “Air Quality Statistics: ENV02 Dataset”
[4] Pope et al., “Relationships Between Fine Particulate Air Pollution, Cardiometabolic Disorders, and Cardiovascular Mortality”
[5] West Midlands Combined Authority, “Air Quality”
[6] Pimpin, Laura et al., “Estimating the Costs of Air Pollution to the National Health Service and Social Care: An Assessment and Forecast up to 2035”
[7] Mazzeo et al., “Modelling the Impact of National vs. Local Emission Reduction on PM2.5 in the West Midlands, UK Using WRF-CMAQ”
The climate and environment fundamental has a strong relationship with our living standards in various ways, including our health and our economy. It is clear from the evidence above that actions which benefit the environment are far from mutually exclusive with those that improve our economy – in fact mitigating the risks of climate change can not only prevent costs, it often leads us to achieve outcomes more efficiently, generating more value to our economy.
We’re often inclined to focus on carbon emissions when discussing this area, and whilst this important, there are many other aspects that play a significant role. Energy usage has achieved an increased focus since the energy crisis began in 2021, and whilst support from the government alleviated a large amount of the extra cost, we can continue to bring energy costs down by increasing the energy efficiency of our housing stock. The West Midlands has the highest level of fuel poverty of any combined authority in England, making this of even higher importance to our residents. Another important area that we can influence is increasing the prevalence of green spaces in our region. Alongside the environmental benefits of increased drainage and carbon capture, this also has tangible health benefits for our communities. Air pollution presents another overlap with health, requiring us to consider how we consume fuel both domestically and through transport.
An inclusive economy is one where everyone has a stake and is fully included in the process of growing a flourishing and sustainable economy, instead of one where a small number of people benefit first, and then wealth is redistributed later or trickled down. This means that our residents should have secure jobs that pay them a living wage and that everyone should be able to reap the financial benefits of economic growth, regardless of their background.
Traditional economic measures in the UK often focus on Gross Domestic Product (GDP) and Gross Value Added (GVA), often used as a proxy for productivity. The WMCA estimates that the West Midlands region will see an annual GVA increase of approximately 1.3% between 2022-2030, less than the average of 1.5% for the UK.[1] This is valuable as it represents the growth in economic output in the region, relative to the rest of the country. It is important to use this measure with caution and an understanding of its limitations, including that growth in GVA has to be countered against price inflation.[2] GVA also only captures economic activity involving financial transactions, meaning that voluntary or unpaid work, including caring responsibilities, are not reflected in the figures. Due to differences in tax and prices between regions, it should not be used as a comparison of the standard of living between different areas.
There is commonly a focus on maximising GDP when discussing macroeconomic topics, with the belief that a growing economy is inherently a healthy one and vice versa, regardless of the source of growth. Unfortunately, all growth is not equal, with variables including geographic location and personal characteristics significantly impacting the level of benefits a person receives from economic growth. Research on changes in the British economy between 2000-2008 found little evidence that economic growth reduced poverty.[3] It was also found that economic growth increased the wages of top earners but not those below the median. Between 2008-2022 the gap between top earners and the median continued to increase at a slightly slower rate, but the gap between the median and low earners reduced considerably, meaning that whilst overall inequality fell during this period, top earners continued to pull away from the rest.[4] A recent report estimates that the deficit in equality between the UK and 23 comparable OECD countries costs the country approximately £106.2bn every year as of 2023, even when only accounting for the impact on health and crime.[5] If the cost to all services was accounted for, this figure would likely be far larger. This means that reducing inequality is not only intrinsically beneficial, but it would also significantly improve the wider economy. Research in America investigated the impacts of eliminating wealth inequalities, with outcomes including increased consumer spending and expanded economic participation, which not only improves lives but also provides increased economic stability.[6]
As GVA only includes paid work done by residents, inequalities in employment in the WMCA area result in reduced GVA. Women are more likely to be economically inactive, and this inequality with men resulted in a loss of around 8.35% of GVA in 2023, more than in any local economy outside of London.[7] A key driver of this inequality is motherhood, with the high cost of childcare in the UK making full time employment economically unviable for many.[8] Better childcare provision would make it possible for mothers to work more, increasing GVA.
Whilst women were more likely to be economically inactive, only 4.4% of women were classed as unemployed compared to 6.8% of men in the WMCA area in March 2024.[9] Our residents are more likely to be unemployed than any other combined authority in England, with an unemployment rate of 5.7% compared to 3.9% for England. The ethnic minority unemployment rate was at 8.9%, 3.2pp more than the average for all employees in the WMCA area of 5.7%. This highlights a lack of opportunities for residents in the WMCA area and shows that the employment disparity between white British residents and ethnic minorities persists.
[1] West Midlands Combined Authority, “West Midlands Plan for Growth: Scale of the Economic Challenge”
[2] City-REDI, University of Birmingham, “What Is Gross Value Added (GVA)?”
[3] Lee, Neil, and Paul Sissons, “Inclusive Growth? The Relationship Between Economic Growth and Poverty in British Cities”
[4] Financial Times, “Inequality Hasn’t Risen. Here’s Why It Feels Like It Has.”
[5] The Equality Trust, “Cost of Inequality 2023”
[6] Dua et al., “The Case for Inclusive Growth”
[7] Millthorne et al., “Women’s Work: A Local Perspective on Gender Inequality”
[8] PwC, “Women in Work Index 2023”
[9] Office for National Statistics, “Annual Population Survey”
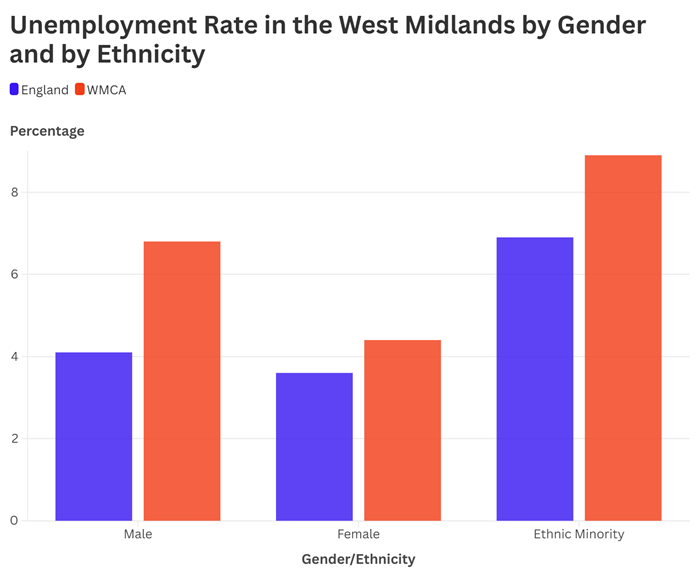
Figure 5: A grouped bar chart comparing the unemployment rate in the WMCA for males, females and ethnic minorities, with the WMCA rate higher in each category
Within the WMCA area, 30.5% of economically inactive residents were classed as on long term sick in the year to March 2024, above the national average of 26.3%.[1] Between 2019-2024 the University of Birmingham estimated that sickness related inactivity rose by 9.8pp, much more than the national average of 6pp.[2] This is a complicated issue but it is clear that more integration between health and employment policies is essential to support residents with health issues and disabilities back into work.
Out of the WMCA area workforce, women were much more likely than men to work part time, with 33.3% of women compared to 11.7% of men in the year to March 2024.[3] Both of these proportions were slightly less than the national average at 36% and 12% respectively. In the UK, Women working part time were less likely to want a full time job than men, highlighting the importance of this option for women.[4] 5% of UK employees held a temporary contract in Q1 of 2024, with 21.2% of this group reporting that they could not find a permanent job. Improved support for those on temporary contracts to help them find permanent employment would reduce their risk of becoming unemployed.
For young adults entering the workforce, unemployment can have more of a scarring effect than it does for older people. Research in the UK has found that each month of unemployment between the ages of 18 and 20 results in an average permanent income loss of 1.2% per year but by the time workers reach 24 this impact disappears.[5] In the year to March 2024, 16.3% of those aged 16-24 in the WMCA area were unemployed, a similar level to Greater Manchester but considerably more than the national average of 11.8%. People in this age group should be a priority for targeted support to find employment to minimise the impact on their future employment opportunities and earnings.
Increased educational attainment has significantly contributed to growth in productivity in the UK.[6] Analysis from the DfE has found that training has a sizable and significant effect on labour productivity, particularly in industries with a greater proportion of highly qualified workers. To ensure that productivity growth is strong in the West Midlands, it is important that businesses are incentivised to invest in training their employees. Approximately 22.1% of residents in the region aged 16-64 were economically inactive in 2024, reducing the number of employees and skills available to businesses which reduces productivity.[7]
[1] Local Government Association, “Percentage of the Working Age Population by Employment Status”
[2] City-REDI, “Uneven Rise in Economic Inactivity: A Growing Concern for the West Midlands”
[3] Office for National Statistics, “Annual Population Survey”
[4] Office for National Statistics, “Full-Time, Part-Time and Temporary Workers, Seasonally Adjusted (EMP01 SA)”
[5] De Fraja, Lemos, and Rockey, “The Wounds That Do Not Heal: The Lifetime Scar of Youth Unemployment”
[6] UK Department for Business, Innovation and Skills, “UK Skills and Productivity in an International Context”
[7] City-REDI, University of Birmingham, “West Midlands Economic Impact Monitor – 30 May 2024”
Steady rates of business birth and survival are an important part of a healthy economy, creating new employment opportunities for residents.[1] Business birth rates fell in England between 2021-2023 by around 13%, but they’ve fallen in the West Midlands region by 23%.[2] Despite the sharper decline in business birth rates between 2021-2023, the birth rate in the West Midlands had grown at an above average speed between 2018-2021, meaning that the proportion of English businesses being born in the region only fell from 9.5% to 9.3%. Businesses created in 2018 had the worst 5-year survival rate of any region in the UK in the West Midlands at 34.7%.
Declining business birth and survival rates stifle productivity growth, harming the local economy.[3] The regional strategic economic plan highlights the importance of improving the skills base within our region to ensure that businesses have access to skills they require. In 2022, employers in the region struggled to fill 35% of vacancies due to a lack of skills amongst applicants.[4] This is clearly an important topic for employers and so upskilling our region’s workforce must be a priority to stimulate economic growth.
The health of our economy is often reported using traditional measures such as GDP, with government missions often built around ensuring positive growth. When discussing productivity, GVA is often used to track fluctuations in the value of paid labour. Economic growth is very complex, and these measures are relatively straightforward and consistent, making them an accessible starting point.
Beyond this, we must understand what GDP and GVA do not measure and be careful not to draw inaccurate conclusions through misapplying them. Whilst growth in GDP equates to increased value of goods and services in the economy, it does not tell us who is benefitting from it.
[1] Office for National Statistics, “Business Dynamism in the UK Economy: Quarter 1 (Jan to Mar) 1999 to Quarter 4 (Oct to Dec) 2019”
[2] Office for National Statistics, “Business Demography, UK”
[3] West Midlands Combined Authority, “Strategic Economic Plan: Full SEP Document”
[4] West Midlands Combined Authority, “Employment and Skills Strategy 2024–2027”
Power and participation are about the extent to which people and have a voice in influencing the things that matter to them. People who feel that they have choice and control over their own personal circumstances, and who feel that they have power to participate and shape the places in which they live and work, will feel a greater sense of belonging and a greater share in the prospects of a place.
Participation by residents can take on many forms, including more traditional forms such as voting in elections and referendums, engaging with elected officials, volunteering in the community and more, along with alternative forms such as attending protests and signing petitions. Of these activities, voting in elections is a traditional measure of the population’s engagement and power to voice their opinion on how decisions that impact them are made. There has been considerable research into what influences election turnout, with a range of factors proposed, including a sense of civic duty, levels of political engagement, and the perceived importance of the outcome.[1] In the 2024 general election, 57.3% of eligible voters in the West Midlands region submitted a ballot, slightly below the national average of 59.7%.[2] Out of the 11 regions of the UK, the West Midlands had the median turnout, with the lowest turnouts in the north of England, Wales and Northern Ireland. At a national level, this represented a fall of around 7.6pp from the 2019 general election, with the fall in the West Midlands slightly higher at 7.8pp.
In the West Midlands region, there are 57 parliamentary constituencies, which 365 candidates contested in the 2024 general election.[3] This means there were an average of 6.4 candidates per seat, less than the average of 6.9 for England, meaning residents in the region had less choice. Turnout fell across the country in 2001 to 59.4%, and despite increases in turnout up to the 2017 election, it fell to only 0.3pp above the 2001 level in 2024.[4] This is still much higher than in elections for local government, with the 2024 mayoral election in the WMCA area seeing a turnout of 29.8%, almost half of the general election turnout for the West Midlands region in the same year.[5] Even the largest turnout at a local election in the WMCA area in 2023, 30.1% in Solihull, falls far short of the 57.3% at the general election.[6]
Data from the Community Life Survey by the Department for Culture, Media and Sport (DCMS) shows that people don’t feel they can personally influence decisions affecting their local area, with only 23% of those surveyed in England in 2023/24 feeling that they can.[7] In the WMCA area, this is slightly higher, with 25% feeling that they can personally influence decisions, but this still represents a minority of residents. This does not seem to be an area of concern for the majority of residents though, as only 29% agreed that they would like to be more involved in decisions made by their council in the WMCA area. Fewer residents in the WMCA area reported any civic participation in the previous 12 months, 29%, than the average for England of 33%. The community life survey defines this as engagement in democratic processes, including contacting a local official, signing a petition or attending a public rally.
[1] UK Parliament POST, “Election Turnout: Why Do Some People Not Vote?”; Stockemer, “What Affects Voter Turnout? A Review Article/Meta-Analysis of Aggregate Research”
[2] House of Commons Library, “2024 General Election: Turnout”; Uberoi and Johnston, “Political disengagement in the UK: Who is disengaged?”
[3] House of Commons Library, “Who Stood in the 2024 General Election?”
[4] House of Commons Library, “2024 General Election: Turnout”
[5] West Midlands Combined Authority, “Election Results”
[6] Local Government Association, “Local Election Turnout”
[7] Department for Culture, Media and Sport, “Community Life Survey 2023/24 Annual Publication”
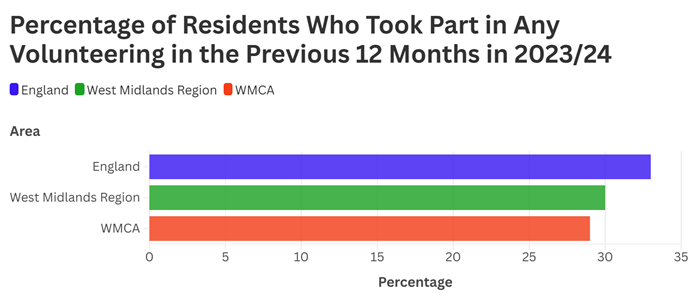
Figure 6: A bar chart comparing the percentage of residents who took part in any volunteering in England, the West Midlands region, and the WMCA in the previous 12 months in 2023/24, with the lowest percentage in the WMCA
Residents can influence their local communities without directly engaging with their council or government. One common form of this is volunteering. The community life survey found that approximately 51% of residents in the WMCA area took part in some form of volunteering within the previous 12 months when asked between October 2023 and March 2024, slightly below the national average of 54%.[1] Research has found that volunteers report higher levels of community identification and social support.[2] This suggests that increased levels of volunteering can improve social cohesion. As only 28% of residents in the WMCA area reported that they trust many of their neighbours, far below the English average of 41%, this is clearly a challenge for our communities.[3] There is also a strong association between volunteering and increased levels of wellbeing and life satisfaction, showing that the benefits extend beyond community participation.[4] It should be a priority to make it easier for people to get involved in volunteering in their community as this can build both participation and improve individual wellbeing.
[1] Department for Culture, Media and Sport, “Community Life Survey 2023/24 Annual Publication”
[2] Bowe et al., “A Social Cure in the Community: A Mixed‐Method Exploration of the Role of Social Identity in the Experiences and Well‐Being of Community Volunteers”
[3] Department for Culture, Media and Sport, “Community Life Survey 2023/24 Annual Publication”
[4] Jenkinson et al., “Is Volunteering a Public Health Intervention? A Systematic Review and Meta-Analysis of the Health and Survival of Volunteers”
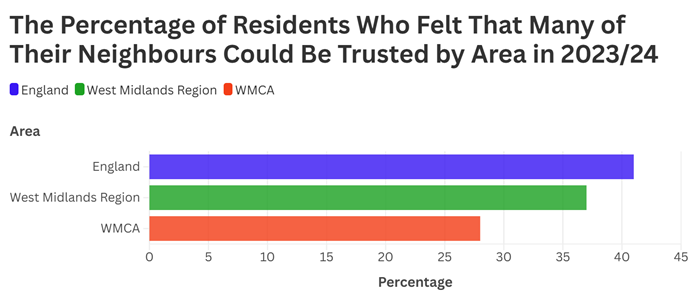
Figure 7: A bar chart comparing the percentage of residents who felt that many of their neighbours could be trusted by area in England, the West Midlands region, and the WMCA in the previous 12 months in 2023/24, with the lowest percentage in the WMCA
A report from the House of Lords highlighted that elections are only one method of participating in democracy and that active citizens should not only be involved in selecting their government but also in how they are governed.[1] Dr Henry Tam, a lecturer at the University of Cambridge and expert on democratic participation, told a House of Lords committee that there is insufficient democratic participation in the UK, and that citizens engage using methods such as protesting but that they do not engage with governing bodies or political institutions.[2] In addition to protests, starting and signing petitions has been a common form of engagement, with the UK Parliament launching a petition service in 2015. Although many of these petitions are ultimately rejected, some have brought about change and this form of engagement serves an important role in a society where many are now digitally engaged.[3]
Whilst residents can choose to engage in democratic processes in their area, there is also an onus on public officials to proactively engage members of the local community. This is most effective when used as a long term tool embedded in the democratic process, rather than for singular legislative issues.[4] An example of this from the WMCA included engaging members of the public through the Greener Together Citizens' Panel which sought to bring together residents to provide their views on how we can approach a variety of issues related to the environment and achieving net zero emissions.[5] The members of the panel were selected with the intention of forming a group that was reflective of the region’s population with regard to a range of characteristics. This helps us to understand the views of a diverse range of communities as well as strengthening the links between them and local government.[6] Co-production of policy and programmes with local residents doesn’t only build better links with the community and increase participation, it also improves the services provided by local government.[7]
[1] House of Lords Select Committee on Citizenship and Civic Engagement, “Chapter 6: Democratic Engagement – Improving Connectivity”
[2] House of Lords Citizenship and Civic Engagement Committee, “Oral Evidence: Local Communities”
[3] Leston-Bandeira, "Parliamentary petitions and public engagement: an empirical analysis of the role of e-petitions"
[4] Chwalisz, “Citizen Engagement in Politics and Policymaking: Lessons from the UK”
[5] West Midlands Combined Authority, “West Midlands Greener Together Citizens’ Panel 2022–2024”
[6] Khan et al., “Diversity, Community Engagement and Co-Design in Research: A Rapid Review”
[7] Vanleene, Verschuere, and Voets, “Benefits and Risks of Co-Production: A Preliminary Literature Review”
Recent national surveys consistently find that public trust in the government is low, although the level of trust in local government is slightly higher than national government.[1] The ONS reported that 34% of people had high or moderately high trust in local government in the UK in 2023, 7pp more than the 27% who said this about the UK Government. A survey from the LGA in 2021/22 found a more pronounced difference, with only 16% of residents in the West Midlands region reporting that they trust the national government to make decisions about services in their local area, whilst 71% would trust their local council.[2] More research is needed to truly understand why residents feel this way.
Developing relationships with underserved communities engages those communities in the democratic process and increases their trust in government. Measuring the trust of constituents in their government is a constant challenge as there are a lack of traditional measures that truly capture it. Trust is a complex intangible state of the relationship between authority and citizens, and so researchers often rely on surveys to gauge the opinions of the public.[3] Unfortunately, these sample sizes are often relatively small and so it can be challenging to understand how trust varies across different regions and communities in Britain.
Due to the nature of its scope, power and participation is an area with less traditional quantifiable measures, outside of election turnouts. Topics such as how engaged members of a community are and how empowered they feel to make change in their local area are very subjective, making it challenging to use rigorous methods. As a result, qualitative research methods such as surveys, interviews and case studies are more prevalent in this area as they allow us to collect rich data on our residents’ views.
Whilst election turnout tells us the proportion of residents exercising their democratic right to decide who governs them, this is only one method of participation. Residents have access to elected officials and can influence their work through various means, including direct correspondence, signing petitions, and engaging in protests. Beyond engaging with the political system, volunteering allows us to have a direct influence in our local area.
In local government, we can also empower our residents by providing them the opportunity to influence our work. Co-production can improve the work we do by incorporating the views and priorities of our residents, which can inform how we design interventions, resulting in more effective outcomes.
[1] Office for National Statistics, “Trust in Government, UK: 2023”; Local Government Information Unit, "The Core Principles of Trust Applied to Local Government"
[2] Local Government Association, “Regional Polling Results”
[3] Hansen, “How Government Efficiency Shapes Political Trust: Evidence from the Case of Brexit”
Affordable and safe places is about everyone having decent homes that they can afford, neighbourhoods where they feel secure, and feel a sense of belonging in the place that they live. When people’s housing and neighbourhoods don’t meet their needs, this can have a serious impact on their health and wellbeing and can limit the future prospects of children growing up in these environments.
The UK Government provides a range of requirements for a dwelling to be considered decent, including that it meets the current statutory minimum standard for housing, is in a reasonable state of repair, has reasonably modern facilities and provides a reasonable degree of thermal comfort.[1] In the West Midlands region in 2023, around 16.1% of homes of all tenures were considered non-decent, one of the highest regional rates in the U.K.[2] Privately rented homes were most likely to not meet the standard, with 25.4% of homes considered non-decent, Local authority and housing association were least likely to be non-decent in the region. Other factors also determined who was more likely to live in a non-decent home, with some groups disproportionately impacted. These groups included, Black residents, those with an income in the lowest quintile, those living in poverty and single occupants aged under 60.[3]
[1] Ministry of Housing, Communities and Local Government, “A Decent Home: Definition and Guidance”
[2] Ministry of Housing, Communities and Local Government, “English Housing Survey 2023 to 2024: Headline Findings on Housing Quality and Energy Efficiency”
[3] Health Foundation, “Inequalities Between Groups of People Living in Non-Decent Homes.”
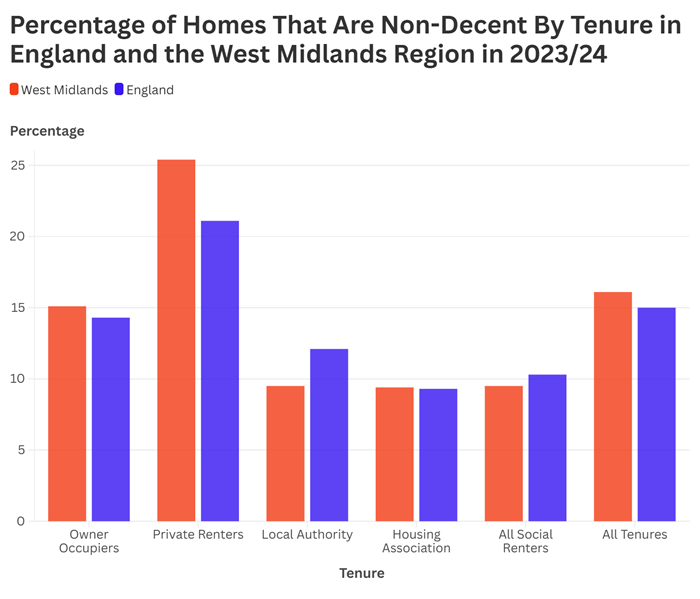
Figure 8: A grouped bar chart comparing the percentage of homes that are non-decent by tenure in England and the West Midlands region in 2023/24, with the West Midlands reporting lower levels for local authority and social housing
Whilst not considered when assessing if a home is decent, 7.8% of homes were considered overcrowded in the WMCA area in 2021, 1.4pp more than the English average.[1] Living in an overcrowded home is associated with worse levels of mental health.[2] A report by the National Housing Federation found that around half of children living in overcrowded homes struggle to do their homework because of a lack of space.[3] They also found that ethnic minorities were three times as likely to be affected by overcrowding. In 2022-23 there were 1.5 million children in England living in homes that did not meet the decency standard, with around 1 million children living in hazardous houses and nearly 800,000 living with damp.[4] The median cost per household to rectify these issues and make these dwellings decent in the West Midlands region in 2022 was estimated to be £6,408, the lowest in England.
The 17.9% rate of fuel poverty in the WMCA area in 2023 was considerably higher than the rate of 11.4% in England..[5] By comparison, Greater Manchester had a fuel poverty rate of 11.9%, 7pp less than the WMCA area.
Damp in a child’s bedroom is associated with increased respiratory problems, highlighting the impact that inadequate homes can have on health.[6] Incidences of damp in homes could be exacerbated by behaviours related to fuel poverty. Fuel poverty in England is measured using the Low Income Low Energy Efficiency (LILEE) indicator. This is defined as living in a property with a fuel poverty energy efficiency rating of band D or below and where spending the required amount to heat the home leaves an income below the poverty line.[7] Where residents are living in fuel poverty, they are likely to avoid turning on their heating as often as they should to save money to cover their other needs.[8] This increases the risk of mould developing and contaminating their home, making it unsafe and non-decent.[9] This is an example of additional costs and health determinants being accumulated due to being poor. Research has shown that there is a relationship between fuel poverty and self-assessed health, highlighting the importance of addressing fuel poverty to improve health outcomes.[10] This represents a hazard and a health risk to residents in these homes.
Homelessness is the ultimate exclusion for citizens and has far-reaching consequences for those affected and for local communities. It can affect anyone, but some people are more at risk than others. Homelessness is legally defined as having no home available anywhere and that can be reasonably occupied.[11] Homelessness manifests in many ways and is not solely about the people sleeping rough, this visible form of homelessness is just the tip of the iceberg.[12] The reality of homelessness is much broader and there are many hidden forms of homelessness that are harder to see and measure including ‘homelessness at home’, squatting, living in temporary accommodation, and sofa surfing.
In 2023/24, 17,310 households were assessed as being owed a homelessness duty in the WMCA area.[13] 57% of those owed a duty were non-white, despite only 39% of the population being non-white. In particular Black British, Caribbean or African applicants made up a significantly large proportion of those owed a duty at 18%, despite only making up 8% of the population.[14]
At the end of March 2024, there were 6,520 households in the WMCA area (there was no data for Wolverhampton) living in temporary accommodation, of these, 5,537 households included children.[15] There were 983 single occupant households. Many of these households comprise of single women living with dependent children. Single women living in these circumstances experience extremely challenging financial conditions, as they struggle to work due to their caring responsibilities.[16] These women are particularly vulnerable as a result, and the living conditions and experiences of this group are an important consideration for policymakers in this area.
Local authority and housing association stock cannot meet the needs of homeless residents, with only 40% of those living in temporary accommodation in this type of accommodation in the WMCA. 42% of these residents live in bed and breakfast hotels (B&Bs), nightly paid accommodation, hostels or authority leased private sector accommodation. The costs to the authority for these types of accommodation are high, and the living standards in B&Bs and hostels are often very poor.[17]
The proportion of people in the UK experiencing homelessness is much larger than in comparable countries, although definitions of homelessness vary.[18] In England, rough sleeping is defined as sleeping, about to bed down or bedded down in the open air, or sleeping in buildings not designed for habitation.[19] For this group of people, health related outcomes are poor, with analysis of hospital admission records finding that the median age of death for people who sleep rough was 20 years younger than those admitted to hospital who were not rough sleeping but living in the most deprived quintile.[20] Rough sleepers were also much more likely to suffer from chronic health conditions such as asthma and COPD than those who are housed.[21] Preventing homelessness by identifying and addressing the different barriers faced by our diverse communities and helping to enhance people’s protective factors so that homelessness can be prevented wherever possible is not only morally desirable, it would also save a significant amount of public money. In 2012, the Government estimated that homelessness in England costs around £1bn per year but this figure is likely much higher now due to the large increase in homelessness figures since then.[22] Shelter reported that local councils had spent £2.3bn just on providing temporary accommodation in 2023/24.[23] Whilst the ratio of residence-based earnings to house prices of 7.1 in the West Midlands region was less than the average for England of 8 in 2023, it is still a sharp rise on the ratio of 5.72 in 2013.[24] Houses becoming less affordable is a key driver of homelessness, meaning that policymakers must work to ensure there is a sufficient supply of affordable housing.[25]
It is crucial that we not only provide safe, affordable and decent homes for our residents to live in, but that we also ensure that the neighbourhood around them is a safe place and that residents feel safe regardless of personal characteristics.
Unfortunately, the more deprived you are in England, the more likely you are to live in a high-crime neighbourhood.[26] Data provided by West Midlands Police shows higher levels of crime in the WMCA area between May 2020 and December 2024.[27] Within this time period, violent crime, shoplifting, possession of weapons and public order offences have all seen a rise. Anti-social behaviour has continued to fall, with 1,992 offences in December 2024, down from 8,340 in December 2010. This could be a sign of a reduction of disturbances in local neighbourhoods, but this decrease could instead reflect a decrease in reporting.
There is a strong link between high levels of neighbourhood crime and mental health conditions including depression amongst residents.[28] Research also shows that when residents feel safe in their communities, they tend to walk more often.[29] This is good for their health and for the environment, reducing emissions generated from journeys that may otherwise have relied on cars. The community life survey found that 62% of residents in the WMCA area were satisfied with their local area as a place to live between January and March 2024, 12pp less than the average in England.[30] Qualitative research aimed at understanding why residents feel this way would help us to prioritise improvements to address this.
A common theme amongst the measures and research for this fundamental is that residents with lower incomes in more deprived areas endure worse living conditions. This was the case for non-decent housing, overcrowding, and fuel poverty. These challenges often present further barriers to living a good quality of life because of poorer health, extra costs, and poorer educational outcomes for young people.
Residents who can’t make ends meet are then faced with the prospect of homelessness. This outcome reflects significant ethnic inequality, with Black British, Caribbean or African residents making up a disproportionately large amount of those applying for relief. A significant number of families living in temporary accommodation are single female parent led. The women living in these situations are vulnerable, but local authorities are so overwhelmed by the scale of this challenge that they cannot meet their needs. Local Councils spent an estimated £2.3bn just on providing temporary accommodation in 2023/24, demonstrating the high cost of this issue.
Building safe communities in our region is not only important for the wellbeing of residents, but also for improving mental health and creating an environment where people feel safe to walk more. Residents in the WMCA area were considerably less likely to report being satisfied with their local area than the national average.
[1] Local Government Association, “Overcrowding”
[2] Health Foundation, “Relationship Between Living in Overcrowded Homes and Mental Health”
[3] National Housing Federation, “Overcrowding in England 2023”
[4] Ministry of Housing, Communities and Local Government, “English Housing Survey 2022 to 2023: Housing Quality and Condition”
[5] Department for Energy Security & Net Zero, “Sub-regional Fuel Poverty in England, 2025 Report (2023 Data)”
[6] Ruffles, et al., “Visible Damp in a Child’s Bedroom Is Associated with Increased Respiratory Morbidity in Early Life: A Multicentre Cohort Study”
[7] UK Government, “Fuel Poverty Statistics”
[8] Department for Business, Energy & Industrial Strategy, “Research into the Behaviours and Attitudes of the Fuel Poor in England”
[9] Sharpe, Thornton, Nikolaou, and Osborne, “Fuel Poverty Increases Risk of Mould Contamination, Regardless of Adult Risk Perception & Ventilation in Social Housing Properties”
[10] Kahouli, “An Economic Approach to the Study of the Relationship between Housing Hazards and Health: The Case of Residential Fuel Poverty in France”
[11] Public Health England, “Homelessness: Applying All Our Health”
[12] West Midlands Combined Authority, “Designing Out Homelessness: Briefing Paper”
[13] Ministry of Housing, Communities and Local Government, “Statutory Homelessness in England: Financial Year 2023–24”
[14] West Midlands Combined Authority, “West Midlands State of the Region 2024–2025”
[15] Ministry of Housing, Communities and Local Government. “Statutory Homelessness in England: Financial Year 2023–24.”
[16] Beadle, “Single Mothers’ Experiences of Temporary Accommodation: a Suffolk-based Study”
[17] Shelter, “Homelessness Bill Doubles in Five Years to £2.3bn”
[18] Herre and Arriagada, “Homelessness”
[19] Ministry of Housing, Communities and Local Government, “Homelessness Data: Notes and Definitions”
[20] Aldridge et al., “Causes of Death among Homeless People: A Population-Based Cross-Sectional Study of Linked Hospitalisation and Mortality Data in England.”
[21] Lewer et al., “Health-Related Quality of Life and Prevalence of Six Chronic Diseases in Homeless and Housed People: A Cross-Sectional Study in London and Birmingham, England”
[22] Ministry of Housing, Communities and Local Government, “Evidence Review of the Costs of Homelessness”
[23] Shelter, “Homelessness Bill Doubles in Five Years to £2.3bn”
[24] Office for National Statistics, “Private Rental Affordability, England and Wales”
[25] Ministry of Housing, Communities and Local Government, “Homelessness: Rapid Evidence Assessment”
[26] https://www.health.org.uk/evidence-hub/our-surroundings/safety/inequalities-in-likelihood-of-living-in-high-crime Health Foundation, “Inequalities in Likelihood of Living in High-Crime Neighbourhoods”
[27] UKCrimeStats, “West Midlands Police: Crime Statistics”
[28] Baranyi, Dibben, and Pearce, “Neighbourhood Effects on Mental Health: A Systematic Review and Meta-Analysis”
[29] Mason, Kearns, and Livingston, “'Safe Going': The Influence of Crime Rates and Perceived Crime and Safety on Walking in Deprived Neighbourhoods”
[30] Department for Culture, Media and Sport, “Community Life Survey 2023/24: Annual Publication”
Connected communities are about the extent to which people can interact with the world around them. This includes both physical connectivity, in terms of people having quick and reliable transport connections to reach places where they can live, work, play, and meet each other; as well as digital connectivity and inclusion.
A strong public transport system is a priority for several reasons, including connecting residents with each other, public services, work, education and leisure, and reducing negative environmental impacts by providing a viable alternative to driving a car. For many, public transport is still not providing the alternative required to get them to work, with 53.1% of drivers surveyed in metropolitan areas of the West Midlands reporting that they would find it difficult to work without access to a private vehicle, including 20.9% who said it would be very difficult.[1] This proportion is large, but it was the lowest of any surveyed metropolitan region of England outside of London. For non-metropolitan areas of the West Midlands, 49.5% of residents reported that it would be very difficult, which highlights the reduced range of transport options in less urban areas. The most common difficulty reported when using public transport or active travel to get to work in 2022 was quality, although the proportion of people reporting this was at its lowest since 2012.[2]
Affordability has become a more common concern in recent years. Research provides a range of definitions of what constitutes transport poverty, but a common definition of affordability is a system which requires a household to spend less than 45% of its budget on both housing and transport.[3] A report defining transport poverty to be when the costs of transport drive a household into poverty, estimated that transport costs put more than 5 million people in the UK below the poverty line, with the West Midlands being disproportionately impacted at around 11.9% of residents.[4] The same report also notes that driving by car is the most expensive mode of transport, meaning that affordable and high quality public transport connections are of high importance to those with lower incomes.
Income is clearly an important factor in car ownership, as households in the top 3 income quintiles have very similar levels of car ownership, but this drops considerably in the fourth and fifth quintiles.[5] Data from Transport for West Midlands (TfWM) shows that there has been a slight reduction in the proportion of households in the bottom quintile without access to a car between 2002 and 2019, but there is still significant income-based inequality. If households on low incomes had the same level of car access as those on high incomes this would significantly increase residents’ access to jobs and other services, but would exacerbate other issues, including carbon emissions, congestion and strain on infrastructure.
According to data from TfWM people with cars can access more than those without.[6] Most West Midlands residents could access more than double the job opportunities within 45 minutes of where they live with a car than without a car. Given that 1 in 4 households in the West Midlands do not have access to a car, this places a significant limitation of their ability to access employment opportunities. Of course, this reduction in accessibility is not limited to employment and affects many other areas of residents' lives. Ensuring people have access to a reliable and affordable public transport network can help make opportunities more accessible.
Whilst it is clear that transport connectivity and affordability are important, particularly to those with lower incomes, these are not the only considerations needed to serve our communities. Certain groups are more likely to rely on public transport to connect them with people and locations than others. Data shows that young adults and those with mobility difficulties are more likely to use public transport than other groups.[7] In 2019, young adults aged 17-20 in England were the age group most likely to travel by both bus and rail, with elderly people much more likely to choose the bus than rail.[8] This is likely due to the incentive provided by bus passes for elderly people, and the difference in their transport needs, with retired people not having to commute over long distances. Those with mobility issues were much more likely to choose the bus than rail but also made 38% fewer trips than those without mobility issues. This highlights the importance of good bus networks to these particular communities, but it also raises the question of why elderly people and those with mobility issues are less likely to use rail. Likely reasons for this include travel distance to stations, platform design, unclear signage and announcements, and difficulty boarding and using seats.[9] Reliability and the impact of delays can also be a significant barrier to disabled people.[10] A government report on the experiences of people living with non-visible disabilities including those with communication or sensory challenges found that communication expectations, noise and overcrowding, and a lack of visible staff to assist were common barriers to accessing public transport.[11] Approximately 1 in 5 people in the West Midlands have a long term condition or disability that limits their day to day activities meaning that this is a large group to consider when evaluating transport provision.[12]
[1] Health Foundation, “Inequalities in Who Relies on a Private Vehicle to Travel to Work”
[2] Health Foundation, “Transport Problems When Travelling to Work”
[3] Litman, “Transportation Affordability: Evaluation and Improvement Strategies”
[4] Social Market Foundation, “Getting the Measure of Transport Poverty”
[5] Transport for West Midlands, “Local Transport Plan: Green Paper”
[6] Transport for West Midlands, “Local Transport Plan: Green Paper”
[7] Department for Transport, “People with Non-Visible Impairments: Attitudes to and Experiences of Transport”
[8] Department for Transport, “National Travel Survey 2022”
[9] UK Parliament, “Written Evidence: Transport Accessibility”
[10] Mwaka, Best, Cunningham, Gagnon and Routhier, “Barriers and Facilitators of Public Transport Use among People with Disabilities: A Scoping Review”
[11] Motability Foundation, “Building a Better Understanding of the Transport Lives of Disabled People: Research Summary”
[12] West Midlands Combined Authority, “Include Me WM Report: Improving the Life Chances of Disabled Citizens in the West Midlands by Being Active”
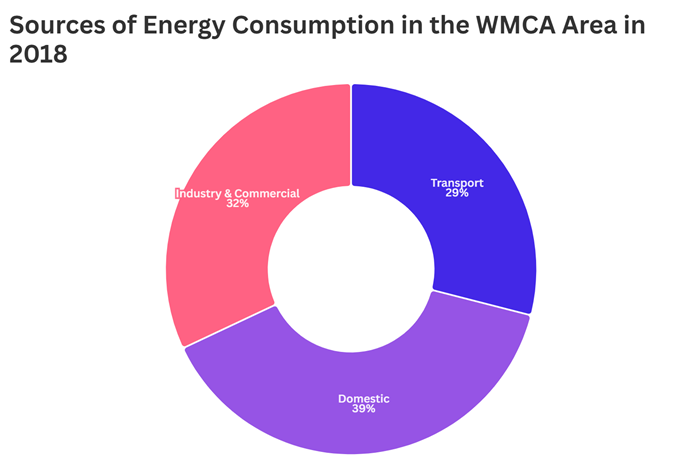
Figure 9: A pie chart comparing the proportion of energy consumption from industry & commercial, transport, and domestic sources in the WMCA area in 2018, with the largest contributor being domestic sources
It was estimated that in 2018, 29% of all energy consumption in the WMCA area came from transport, highlighting its major contribution to climate change.[1] Given that many residents reported that it would be difficult for them to travel to work without access to a car, and data showing that cars produced an estimated 57% of greenhouse gas emissions from road transport in 2021, it is a priority to ensure that sufficient and environmentally friendly alternatives are available.[2] It is estimated that around 2300 people die early every year because of air pollution in the West Midlands, with every area exceeding the WHO’s guidelines.[3] The University of Birmingham estimates that improving the air quality of the region to meet these guidelines could save as much as £3.2bn over 20 years from improved health outcomes. This is important to residents in the region, as surveys conducted by TfWM in 2020 during the COVID-19 pandemic found that 81% of respondents wanted to see cleaner air as a result of the crisis.[4] Despite this, in Summer 2020 only 8% of residents named the environment as their top priority for the region’s recovery, highlighting that whilst this is an important issue to residents, they also have essential needs which the region must address. We must adapt our transport network to meet these needs whilst developing an environmentally sustainable system.
In the WMCA area, the proportion of adults walking or cycling at least 5 times a week fell from around 29.6% to 26.8% between 2019 and 2020, having remained stable since 2016.[5] This proportion has remained stable since 2020, meaning that our residents have utilised these methods of transport less frequently since the COVID-19 pandemic. The proportion of 27.1% in 2023 was considerably lower than the English proportion of 34.3%. The proportion walking or cycling 5 times a week for travel fell in 2020, whilst those doing it for leisure increased to counter some of the overall decrease, but the figures for both of these categories appear to be gradually returning to pre-pandemic levels.
[1] West Midlands Combined Authority, “GHG Emissions in the West Midlands Combined Authority”
[2] Department for Transport, “Transport and Environment Statistics 2023 (2021 data)”
[3] University of Birmingham, “West Midlands Air Pollution Causing Up to 2,300 Early Deaths Each Year”
[4] Transport for West Midlands, “Local Transport Plan: Green Paper”
[5] Department for Transport, “Walking and Cycling Statistics”
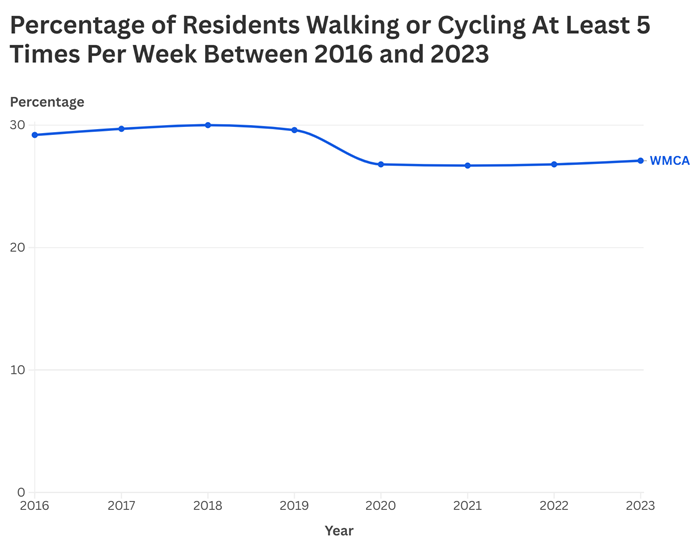
Figure 10: A line chart displaying the percentage of residents in the WMCA area walking or cycling at least 5 times per week between 2016 and 2023, with the percentage remaining consistently lower since the COVID-19 pandemic in 2020
Whilst alternative options such as rail and bus can replace long car journeys, active travel options are suitable for shorter journeys within the local area. Not only can these options be more environmentally friendly by reducing carbon emissions, but they often also improve the health of the transport user. Residents in the West Midlands region walk less than in any other region in England and cycle much less than the national average.[1] It is estimated that if all regions walked and cycled as much as the most active region, around 1,800 early deaths in England would be prevented each year. Not only does increased walking and cycling provide better health outcomes, but research also found that they could replace approximately 41% of short car trips, reducing around 5% of all car produced CO2 emissions.[2] The WMCA state that the cycling network in the West Midlands is over 342 miles long, with funding allocated to extend this.[3]
As technology advances, there is an increasing number of people connecting with each other and services digitally rather than relying on transport to meet others and go to work. Although this has great potential for many of our residents, the WMCA reported in 2022 that nearly half of the West Midlands population had poor access to the internet, including 22% who did not use or have access to the internet at all, above the average for the UK of 15%.[4] The Lloyds Consumer Digital Index found in 2024 that significant progress had been made nationally to address this and that the proportion of those digitally excluded fell to 3%.[5] A cross-departmental policy paper was published on this topic in 2025 where the government outlined their main areas of focus to address digital inclusion in the UK and launched a call for evidence.[6]
Being digitally excluded not only makes it more difficult to connect with others, it can also have a serious economic impact on the poorest members of society, with research showing that those who are digitally excluded are less able to access cheaper goods and services, costing them an estimated £478 a year on average.[7] Having access to the internet at home also allows people to apply to a much wider range of job vacancies, access educational resources and courses, and take on jobs that require internet access for homeworking. For those with mobility issues, having this option this can make work more accessible as they have more control over their working environment.[8]
There are a range of factors that cause people to be digitally excluded, including the cost of devices and broadband, a lack of digital skills or confidence navigating the internet, and concerns about privacy and how personal data is used. The Consumer Digital Index also found that a significant barrier for many who are digitally excluded was a lack of interest in accessing the internet. It is important for policymakers to consider how to engage this group as the 2020 version of Lloyds Bank’s Consumer Digital Index reported that digitally enabled manual workers earn an average of £2,160 more per year than those who are excluded, highlighting the high cost of digital exclusion.[9] Increasing residents’ access does not only benefit individuals, research in 2022 found that every pound invested in building the digital skills of excluded people returns around £9.48 to the economy, worth an estimated total of £12.2bn nationally.[10]
Residents in the lower income brackets are less likely to have access to a car, resulting in fewer accessible job opportunities, which limits their ability to alleviate their circumstances. Affordable and high-quality public transport are important to reduce the impact this has. Quality is the most common issue raised by public transport and active travel users, Accessibility presents a barrier to those with mobility issues using public transport, particularly regarding rail.
Public transport and active travel are also important for reducing greenhouse gas emissions in the WMCA area. The health benefits of improving air quality to the WHO guidelines could be worth £3.2bn over 20 years. Increased levels of walking and cycling also make a big difference, with an estimated 1,800 deaths per year preventable if all regions walked and cycled as much as the most active region.
Digital connectivity is a persistent challenge for some residents. Lack of access to the internet restricts access to cheaper products and services and to better jobs. Those excluded are likely to benefit the most from this.
[1] Health Foundation, “Health Benefits of Walking and Cycling”
[2] Neves and Brand, “Assessing the Potential for Carbon Emissions Savings from Replacing Short Car Trips with Walking and Cycling Using a Mixed GPS-Travel Diary Approach”
[3] West Midlands Combined Authority, “Cycling and Walking in Birmingham”
[4] West Midlands Combined Authority, “Digital Inclusion”
[5] Lloyds Bank, “Consumer Digital Index 2024”
[6] UK Government, “Digital Inclusion Action Plan: First Steps”
[7] Understanding Society, “Digital Exclusion Worsens Cost-of-Living Crisis”
[8] Lake and Maidment, “Is This a New Dawn for Accessibility? A Qualitative Interview Study Assessing Remote Working Experiences in Adults with Physical Disabilities Post COVID-19”
[9] Lloyds Bank, “Consumer Digital Index 2020”
[10] Good Things Foundation, “Solve Digital Exclusion and the Cost-of-Living Crisis.”
Education and learning opportunities are important for everyone at any age, to enable them to flourish and reach their potential. From giving children and young people the best start in life, to providing opportunities for working aged and older adults to gain new skills, retrain for a new job or just pursue their own interests for leisure. All types of learning are important for an inclusive society.
Research shows that people with a level 3 qualification (e.g. an A Level) are more likely to be employed, earn more when employed and less likely to claim out of work benefits than those qualified at level 2 (e.g. a GCSE) or below.[1] Unfortunately, estimates from the Annual Population Survey show that the WMCA had the lowest proportion of residents holding at least a level 3 qualification of any combined authority in England in 2023, at 60.7%.[2] This level is 6.7pp below the average for England,
Achieving a university degree has a significantly positive impact on a young person’s potential career earnings.[3] Due to a variety of factors, the progression rate to higher education varies considerably based on all kinds of factors. In the West Midlands region in 2022, only 29.5% of young people who were eligible for free school meals progressed on to higher education.[4] The rate was far higher for those not eligible at 48.4%. The progression rate gap in the West Midlands is 18.9%, the largest it has been in the available data from 2009. This means that those from less able backgrounds are significantly less likely to have access to higher education, a barrier which has a profound impact on their future earnings.
[1] West Midlands Combined Authority, ”Improving the Level 3 Skills Offer for Adults”
[2] Office for National Statistics, "Level 3 or Above Qualifications"
[3] Resolution Foundation, “Are Universities Worth It?”
[4] Department for Education, "Widening participation in higher education"
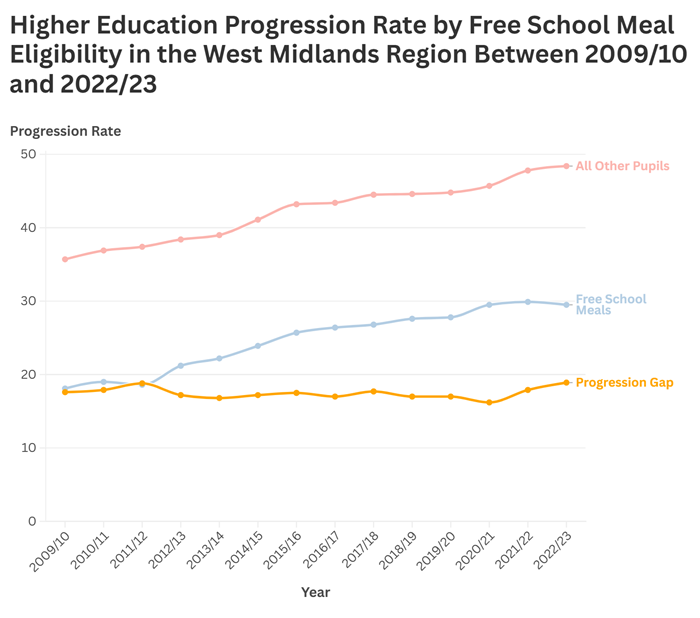
Figure 11: A line chart showing the higher education progression rate by free school meal eligibility in the West Midlands region between 2009/10 and 2022/23, with the progression gap remaining fairly consistent
The number of skills-shortage vacancies has risen considerably across the country in recent years, with around half of all vacancies in the West Midlands in 2022 classed as hard to fill, and with 35% vacant because the applicants lacked the skills, qualifications and experience required.[1] Whilst these proportions are large, they are below the national average. This shows that development of the UK workforce has not kept up with the growth in high skilled jobs. By 2035, the Skills Imperative forecasts 55% of roles in the West Midlands will require skills at Levels 4 and above.[2] An estimated 6% of employees in the region are not fully proficient in the skills required for their job, slightly more than the national average of 5.7%. This skills gap reduces productivity, which in turn harms the economy and jobs.
In addition to the productivity and growth impact on the region, different levels of educational attainment result in very different levels of earnings across an individual’s life.[3] Higher levels of educational achievement don’t only result in improved earnings, they also indicate improved social-emotional development, including mental health and wellbeing, general life satisfaction and standard of living.[4] Analysis of OECD countries found that the rate of post-secondary education (e.g. tertiary) had the strongest influence on life expectancy.[5]
Apprenticeships are proven to be effective routes into employment for many, whilst achieving an “on-the-job” qualification. Unfortunately, the number of apprenticeship starts has been falling in recent years in the WMCA area, a pattern which is consistent with the rest of the country but falling at a higher rate here. Between 2018/19 and 2023/24, apprenticeship starts fell by 22% in the WMCA area, 8pp more than the national average.[6] Despite the overall decrease, advanced level apprenticeship starts which are a level 3 qualification, have remained stable, giving residents the opportunity to upskill.
[1] West Midlands Combined Authority, “Employment and Skills Strategy 2024–2027”; Department for Education, “Employer Skills Survey 2022”
[2] Department for Education, “Labour Market and Skills Projections 2020 to 2035”
[3] Department for Education, “GCSE Attainment and Lifetime Earnings”
[4] Starr, Haider, and von Stumm, “Do School Grades Matter for Growing Up? Testing the Predictive Validity of School Performance for Outcomes in Emerging Adulthood”
[5] Raghupathi and Raghupathi, “The Influence of Education on Health: An Empirical Assessment of OECD Countries for the Period 1995–2015”
[6] Department for Education, "Apprenticeships 2023–24"
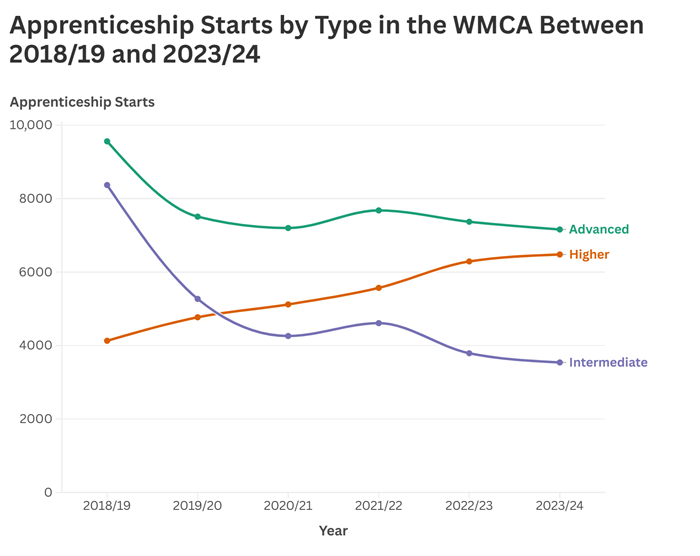
Figure 12: A line chart showing the number of apprenticeship starts by type in the WMCA between 2018/19 and 2023/24, with higher apprenticeship starts rising and intermediate and advanced falling
Research shows that level 3 apprenticeships particularly benefit young men, providing earnings more than 40% higher than those who studied an equivalent classroom-based qualification at the age of 23.[1] Degree apprenticeships, which are level 6 or 7 qualifications, have expanded in recent years, but The Policy Institute at King’s College London found that these courses provide less social mobility than regular university degrees.[2] Only 5% of those on degree apprenticeship courses were eligible for free school meals, compared to 17% for regular degrees, and the completion rate was only 55%, far less than the 89% of traditional degrees.
Whilst apprenticeship starts have been falling since the mid-2010s, investment in training by employers in the West Midlands region remained strong in 2019, with a larger spend per employee of £2,037 (adjusted to 2022 prices) than in any other region in England.[3] The region saw an increase despite a weak national picture. Unfortunately, in 2022, investment in training for employees in the region fell sharply to £1,585, a decrease of approximately 22%. This meant that employees received an average of £203 less investment in training than the average employee in England.
Achieving a grade 4 or above in GCSE level Maths and English is an important step for secondary school pupils as it is often a pre-requisite for courses and apprenticeships.[4] In the West Midlands region, a lower proportion of pupils have achieved this standard than the national average in every year since 2018/19.[5] In 2023/24, this proportion was 62.2%, 3.2pp below the average. There was a large variation in attainment based on different characteristics, with the proportion of those eligible for free school meals achieving the standard 26.3pp lower than those not eligible. For SEN pupils, the gap was 41.3pp, slightly below the national gap of 42.0pp. The proportion of girls achieving the standard was 5.9pp higher than the proportion of boys, a slightly larger gap than the 5.0pp nationally. The variation by ethnic group is considerable, but the average for mixed White and Asian pupils was 10.1pp lower in the West Midlands than nationally. Data on these variations is important for the WMCA because it provides insights on which groups and communities have better or worse educational outcomes, which has a strong association with future earnings.[6] This assists us in predicting where to prioritise adult education programs
[1] Department for Education, “Labour Market Value of Higher and Further Education Qualifications: A Summary Report”
[2] Resolution Foundation, “Are Universities Worth It?”
[3] Department for Education, "Investment in Training”
[4] Nuffield Foundation, "Progression from GCSEs Not Working for Many Young People"
[5] Department for Education, "Key stage 4 performance "
[6] UK Government, "Higher GCSE Grades Linked to Lifetime Earnings Boost"
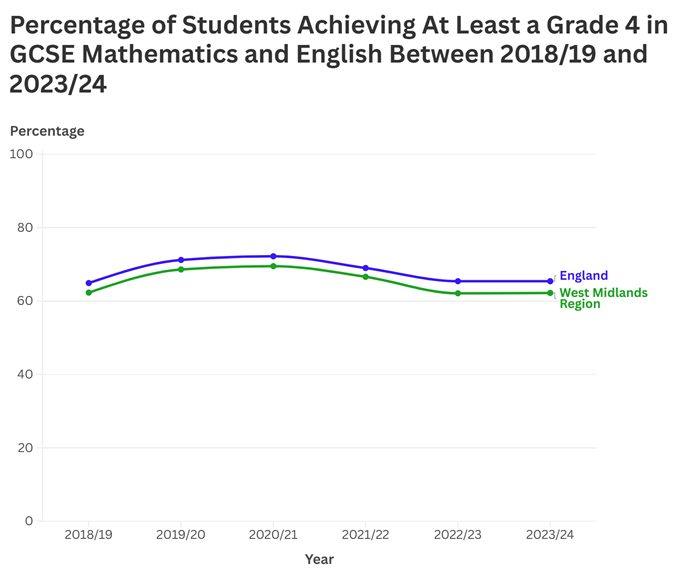
Figure 13: A line chart comparing the percentage of students achieving at least a grade 4 in GCSE Mathematics and English in England and the West Midlands region between 2018/19 and 2023/24, with the West Midlands consistently below the national average
Pupils in the West Midlands are slightly more likely to be absent from school than the average in England, with 7.3% in the 2023/24 academic year compared to 7.1%.[1] Despite absence levels falling gradually between 2006/07 and 2019/20, there was a large spike in 2021/22. Whilst there has been a decrease in absences in the two years since, the rate is still above that seen in 2006/07. 21.1% of pupils in the West Midlands were persistently absent in 2023/24, 1.1pp more than the national average. Only 40% of pupils who are persistently absent will achieve the expected standard in key stage 2, as opposed to 84% of their peers who don’t miss a day.[2] In addition to this, research shows that pupils facing barriers such as growing up in poverty, experiencing a mental health crisis or with Special Educational Needs (SEN), are significantly more likely to be permanently excluded than their peers, highlighting the role that health and wellbeing, and equalities has in access to education. It has been estimated that the cost to the state on average is over £170,000 per excluded child.[3] A further barrier to school attendance is cost of living, with the cost of attending primary school averaging £864.87 per child and attending secondary school costing £1755.97.[4]
[1] Department for Education, "Pupil Absence in Schools in England"
[2] Department for Education, “Why Is School Attendance So Important and What Are the Risks of Missing a Day?”
[3] IPPR, “Who Is Losing Learning? The Case for Reducing Exclusions across Mainstream Schools”
[4] Child Poverty Action Group, "How School Costs Make It Harder to Go to School"
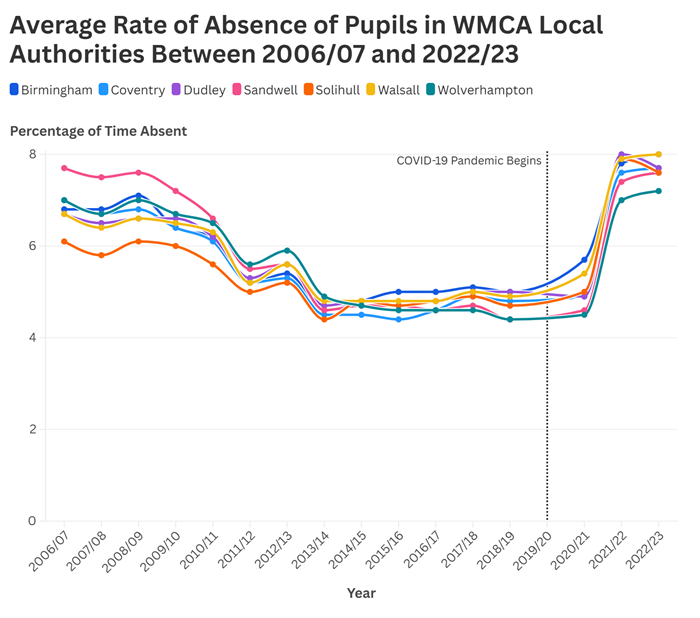
Figure 14: A line chart showing the average rate of absence of pupils in WMCA local authorities between 2006/07 and 2022/23, with absences rising after the COVID-19 pandemic in 2020
Negative housing attributes, including cold homes and overcrowding, are linked with poorer health outcomes, but also with lower educational attainment.[1] Health issues caused by living in environments like this have a secondary impact of increased absence from school, which is known to result in worse academic attainment. Along with the associated health risks, overcrowding can restrict children from finding space to study and do homework.[2]Another disadvantaged group, young people in the care system, are much more likely to experience negative outcomes. Research shows that approximately 40% of care leavers in the West Midlands are classified as Not in Employment Education or Training (NEET), between the ages of 19-21. Poor social outcomes for this group are estimated to cost the region £307.3m a year.[3]
In 2024, an estimated 5.6% of young people aged between 16-17 in the WMCA area were classed as NEET or not known.[4] This is slightly lower than the 6.1% for the wider West Midlands region, but slightly higher than the 5.4% level for England. The proportion was estimated to be 10.7% for Dudley in 2024, which was the 4th highest rate for local authorities in England.
[1] University of Birmingham, “Good Housing Better Health”
[2] Solihull Metropolitan Borough Council, “Health Equalities Assessment of the Housing Strategy”
[3] Become Charity, "Regional Statistics About the Care System"
[4] Department for Education, "Participation in education, training and NEET age 16 to 17 by local authority"
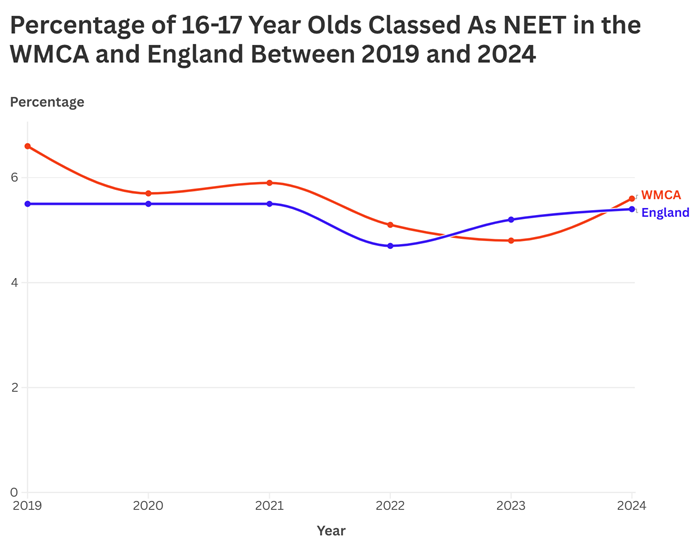
Figure 15: A line chart showing the percentage of 16-17 year olds classed as NEET in the WMCA and England between 2019 and 2024, with the WMCA rate higher in every year except 2023
Prolonged periods of being NEET have a significant impact on the duration of a person’s working life. Research shows that those who experience youth unemployment are more likely to have reduced wellbeing and lower earnings, even 35 years later.[1] Research in the UK has found that each month of unemployment between the ages of 18 and 20 results in a permanent income loss of 1.2% per year but by the time workers reach 24 this impact disappears.[2] There are a multitude of factors behind why a young person experiences prolonged unemployment, but a House of Lords Committee report found skills gaps and insufficient support for disadvantaged young people to be key drivers.[3]
Education can be a vehicle to success, providing employment opportunities and other skills to help residents enjoy a good quality of life. It is clear from the evidence presented under this fundamental that those in disadvantaged groups are less likely to achieve good grades, more likely to be absent from school, and less likely to attend university. This reinforces those inequalities, which is why it is so important to focus on providing targeted support to young people to help break the cycle. Poor housing also exacerbates these challenges, with links to reduced attainment, and increases in school absences through increased health issues.
The region, along with the rest of the country, has experienced falling apprenticeship starts, reduced investment in training by employers, and large proportions of vacancies remaining empty due to skills shortages. Reduced routes to skill development harm the economy and increase the burden on public services.
[1] Clayton and Williams, “Delivering Change: Cities and the Youth Unemployment Challenge”
[2] De Fraja, Lemos, and Rockey, “The Wounds That Do Not Heal: The Lifetime Scar of Youth Unemployment”
[3] House of Lords Library, “Causes of Youth Unemployment: Lords Committee Report”
Prioritising our residents’ health and wellbeing ensures that they live long and healthy lives and that they receive high quality care and support when they need it. When we are in good health and have the security of strong healthcare provision, we are able to live independent and fulfilling lives and do the things that are important to us and make us happy. This is a reciprocal relationship as being able to do these things increases our health and wellbeing.
For a male baby born in the local authority with the lowest healthy life expectancy in the WMCA area between 2021-2023, it is estimated that they will live in good health for approximately 7.6 years less than a baby born in the local authority with the highest healthy life expectancy.[1] For a female baby, the difference is 8.6 years. This means healthcare providers serving neighbourhoods where this estimate is lower will likely need increased capacity to meet the needs of residents in their area. The inequality in life expectancy in the West Midlands region for males was 10.5 years between 2021-2023 and 8.5 years for females.[2] Both of these figures have increased by between 1 and 2 years since 2010-12, showing that the impact of where someone is born on the length of their life is increasing.
[1] Office for National Statistics, “Healthy Life Expectancy in England and Wales: 2011 to 2013 and 2021 to 2023”
[2] Public Health England, “Life Expectancy in the West Midlands”
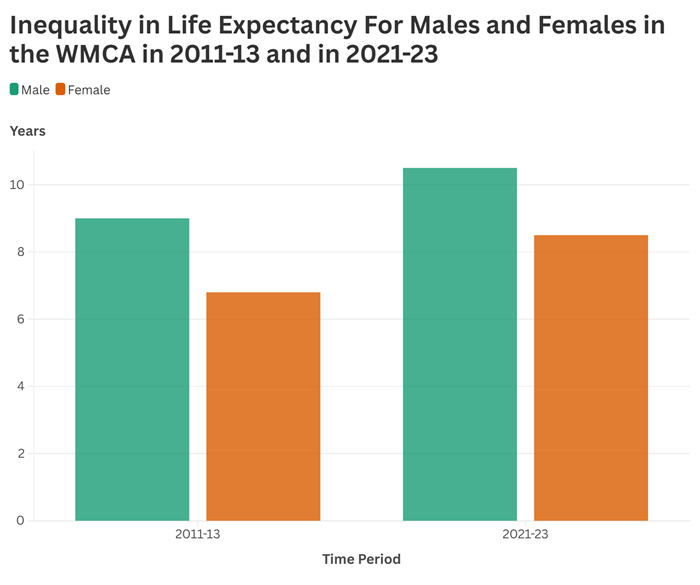
Figure 16: A grouped bar chart showing the inequality in life expectancy for males and females in the WMCA in 2011-13 and in 2021-23, with inequality increasing for both genders
An individual’s health and wellbeing have strong ties to a wide range of factors including their household income, provision of health services in their area and variables such as air quality and pollution. As these factors vary considerably between different communities, this creates significant inequalities in measures of health between different groups. Research shows that the more deprived background a child or young person came from, the more likely they were to receive emergency admissions for a range of health conditions, including asthma and diabetes.[1] The impact of deprivation is felt throughout a person’s life, with a significant number of premature deaths attributable to inequality. A research study found that approximately one person in England dies prematurely every 10 minutes because of inequality, with a total loss of life expectancy of 3.3 years for those aged under 75.[2]
Residents living in the West Midlands region were slightly less likely to report low life satisfaction than the rest of England in 2023, with 5.2%, 0.4pp less than the national average.[3] Despite this, only Solihull in the WMCA area had a smaller proportion than the average for the region, whilst 9% of respondents in Wolverhampton reported a low life satisfaction.
Analysis by the ONS found that the three characteristics which had the largest contribution to life satisfaction were self-reported health, marital status with higher levels for those who were married or in a civil partnership, and employment status.[4] Whilst cause and effect cannot be established from the data, policymakers should focus on improving health outcomes and supporting those who are economically inactive or unemployed into work to improve general life satisfaction amongst residents.
There has been a sharp increase in estimates of mental health conditions amongst 17- to 19-year-olds in the West Midlands region from 10% in 2017 to 23.3% in 2023. This has been felt strongly in the region, with an increase in demand for child mental health services by around 50%.[5] There has also been a sharp increase in demand for adult mental health services across England, with an estimated 8.5 million adults and 1.5 million children needing mental health support by 2027 due to the effects of the pandemic.[6] There are a large variety of factors that can impact a person's mental health and lead them to seek support. A major cause of this is loneliness, with people reporting this being 2.25 times more likely to have a depression diagnosis, with social isolation causing lower levels of happiness and meaning in life.[7] The Centre for Mental Health estimated from the 2022 Labour Force Survey that those reporting mental health issues had a 17.15% lower salary on average, which would mean around £5,600 less income per year.[8]
The biggest preventable cause of cancer in England remains smoking, with an estimated 11.6% of adults smoking regularly in 2023, slightly less than the average for the West Midlands region of 12%.[9] This is a 5.8pp decrease on the level of smoking in the region in 2013, despite a period of increase between 2017-2020. Despite this, the rate of smokers in the region aged 16+ quitting for 4 weeks or more has fallen sharply from around 4.4% in 2013/14 to 0.9% in 2022/23, now below the national average of around 1.6%.
[1] Nuffield Trust, "What Is the Scale of the Challenge to Address Health Inequalities Affecting Children and Young People?"
[2] Newton, “Counting Early Deaths Due to Socioeconomic Inequality”
[3] Office for National Statistics, “Annual personal well-being estimates”
[4] Office for National Statistics, “Personal well-being in the UK: April 2022 to March 2023”
[5] West Midlands Combined Authority, “Mental Health Commission: A Year On Report”
[6] West Midlands Combined Authority, “Towards Mental Health Equality”
[7] Reed et al. “Investigating the Impact of Loneliness and Social Isolation on Health”
[8] Centre for Mental Health, “The Economic and Social Costs of Mental Ill Health”
[9] Public Health England, “Smoking in the West Midlands”
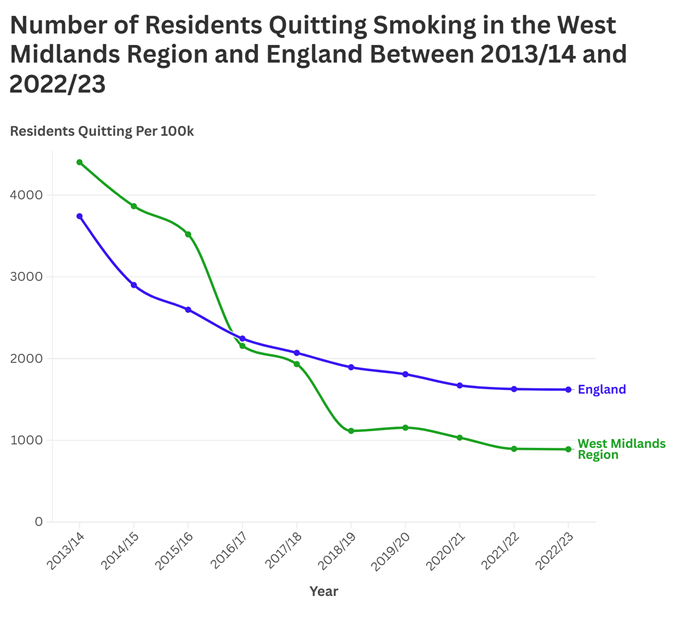
Figure 17: A line chart showing the number of residents quitting smoking in the West Midlands region and England between 2013/14 and 2022/23, with the West Midlands rate higher until 2015/16 and then below the national average
Conditions within a local community have a profound impact on the health and wellbeing of residents. A big factor in this is the level of air pollution which creates a harmful environment to breathe in. Estimates show that the lives of men living in the most polluted neighbourhoods outside of London will be 3.5 years shorter than those living in the least polluted neighbourhoods and 2.5 years shorter for women on average.[1] A healthy balanced diet helps to prevent many common health conditions, ensuring that overall health remains high.[2] Fast food and other unhealthy options reduce health and increase the risk of conditions. Unfortunately, the more deprived a neighbourhood is, the higher the concentration of fast-food outlets is on average.[3] Residents living in neighbourhoods with higher concentrations of fast-food outlets tend to also live shorter lives.[4]
Not only are fast food and unbalanced diets bad for our health and increase our risk of health complications, but they also increase the likelihood that a person becomes obese. Obesity levels have increased considerably in the UK, with the proportion of the population fitting into this category almost doubling between 1993 and 2022.[5] Obesity itself is linked with a range of health issues. The Government says that obesity is the second biggest preventable cause of cancer and that it costs the NHS around £6.5bn every year.[6] The Government also quotes the alarming figure of 23.4% of children aged 10-11 who are obese, which significantly increases their risk of developing type 2 diabetes and cardiovascular diseases in later life.[7] Legislation to ban smoking for people born from 2009 onwards should continue to reduce the number of people who start smoking.[8] Guidance from Public Health England (PHE) in 2015 estimated that 83% of smokers started before the age of 20, which will not be legally possible by 2029.[9] The focus should therefore instead be on helping smokers to quit to increase the rate of reduction in regular smoking. Research shows that this costs the NHS in England £1.9bn, with a total cost including lost productivity reaching £21.8bn.[10] This is far more than the reported revenue generated from tobacco duty of around £8.8bn in 2023-2024.[11]
Traditional measures under the health and wellbeing fundamental tend to include life expectancy, along with more behavioural related outcomes such as obesity and smoking. The research shows that those born in deprived areas will live shorter lives and have poorer health outcomes than those in born in the least deprived areas. The rate of residents in the region smoking has fallen considerably but has remained stable in recent years. With the law changing on the legal age of smoking, the focus of policymakers should be on providing assistance to quit.
Beyond these measures, demand on mental health services has risen in the region in recent years, causing a profound financial impact on the individuals experiencing mental health conditions. Variance in air quality, influenced by pollution, has a significant impact on the health of residents, highlighting the impact of our environment on our health.
[1] Health Foundation, "Relationship Between Air Pollution and Health"
[2] World Health Organization, “Healthy Diet”
[3] Health Foundation, " Relationship Between the Concentration of Fast Food Outlets and Health."
[4] Health Foundation, "Relationship Between Fast Food Concentration and Health"
[5] UK Parliament, “Obesity Statistics”
[6] Department of Health and Social Care, "Government Plans to Tackle Obesity in England"
[7] Weihrauch-Blüher and Wiegand, “Risk Factors and Implications of Childhood Obesity”
[8] Department of Health and Social Care, "Smoking Ban Introduced to Protect Children and Most Vulnerable"
[9] Public Health England, “Health Matters: Smoking and Quitting in England”
[10] Action on Smoking and Health, "Cost of Smoking in England Up 25% to £21.8 Billion"
[11] HM Revenue & Customs, “Tobacco Statistics Commentary: April 2024”
Equality means that people have the opportunity to thrive and flourish regardless of their protected characteristics and backgrounds. It is important for us to ensure that the benefits of economic growth reach all of our residents and this can only be achieved if we listen to the experiences of all groups of our society.
Everyone deserves to be paid a fair wage for their work, and this should not differ based on personal characteristics. The West Midlands is the second most ethnically diverse region in the country, with 66% of the population identifying as white British, but the experiences of residents are not all equal.[1] 1 in 3 residents identifying as black or Pakistani live in deprived areas, compared to only 1 in 12 white British residents. The West Midlands had a 9.5% race pay gap in 2022. In the WMCA area, unemployment levels were 8.1% in September 2024 for ethnic minority residents, with 10.7% of Black residents unemployed.[2] For White residents this level was 4.5%, a significantly lower level which highlights the inequalities in employment opportunities in the area. The 2021 census data showed that as many as 44% of residents in the WMCA area are from an ethnic minority background, which shows the large responsibility that the WMCA has to ensure that these residents have access to good jobs and stable, sufficient incomes.[3] In the year to March 2024, it was estimated that only 3.7% of employed ethnic minority residents in the WMCA area were working in managerial or senior official occupations, compared to 8.7% nationally.[4] This was the lowest proportion of any combined authority in England.
In 2020-21, research showed that the West Midlands region had the highest prevalence of multiple negative job quality aspects in the UK and a national level analysis shows that those of black African or Caribbean background are the most likely ethnic group to have these negative job quality aspects.[5] These negative job quality aspects measured include a range of factors including low pay, low job security and low job satisfaction. A further important finding is that people from an ethnic minority background who were not born in the UK are commonly overqualified for their jobs and tend to be low paid.[6] This is likely due to a range of factors, including discrimination and holding qualifications which aren’t generally recognised by UK employers.
The gender pay gap in the UK was at 13.3% in 2023, larger than the average for the OECD of 13.1%, with concerns that progress towards rectifying this vary considerably by geography.[7] In 2024, this gap fell to 13.1% nationally, and was estimated to be 12% in the West Midlands region.[8] The leading driver of this gap is the impact of motherhood on the earnings of women, particularly due to the costs of childcare which can make it more affordable to leave work.
Research on job quality experiences also found that women were more likely than men to report multiple negative job quality aspects in the UK in 2020-21, with 18% of women reporting this vs 15.4% of men. This highlights the inequality between male and female experiences of work, with 3.5% of women employed on zero-hours contracts compared to 2.8% of men.[9] 72% of part-time workers were women and 10.5% of women were classed as low earners, compared to 7.2% of men. In the WMCA area, there was also an estimated loss in GVA due to the higher rate of women being economically inactive of 8.35% in 2023, higher than any local economy outside of London.[10] Childcare costs in the UK were the second highest in the OECD in 2022, with polling finding that one in three parents of pre-school children spend more than a third of their wages on childcare.[11] Rebalancing the share of parental leave that is taken by mothers and fathers, and increasing the availability of affordable childcare would reduce the economic impact on women by alleviating some of the burden created through having to take on unpaid childcare.
In the UK, the unemployment rate for disabled people was 6.9% in the second quarter of 2024, significantly more than the 3.6% for non-disabled people.[12] In the WMCA area, the unemployment rate for disabled people in September 2024 was 7.9%, above the national average.[13] The employment rate for disabled people was 48.6%, 8.6pp below the rate for England, meaning that the majority of our disabled residents are not employed. 47.2% of disabled residents in the WMCA area are economically inactive, 8.2pp more than the national average, and 28.8pp more than non-disabled residents in our area. One of the impacts of this is that 31% of disabled people in the UK were living in poverty in 2021/22, higher than the average for the population of 22%.[14]
[1] West Midlands Combined Authority, “Race Equalities Taskforce Applicant Webinar”
[2] Office for National Statistics, “Annual Population Survey”
[3] West Midlands Combined Authority, “Race Equalities Taskforce: Why Set Up the Taskforce?”
[4] Office for National Statistics, “Annual Population Survey”
[5] Health Foundation, “Proportion of People in Low-Quality Work by Region, Ethnicity, Age and Sex”
[6] Equality and Human Rights Commission, “The Ethnicity Pay Gap: Executive Summary”; Joseph Rowntree Foundation, “The Effect of Occupation on Poverty Among Ethnic Minority Groups”
[7] PwC, “Women in Work 2025”
[8] Office for National Statistics, “Gender Pay Gap”
[9] Women’s Budget Group, “The Feminist Future of Work”
[10] Millthorne, Bettany, Eyres, Reis, Adamson, and Longlands, “Women’s Work: How Gender Equality Can Deliver Stronger Local Economies”
[11] Statham, Parkes and Nanda, “Towards a Childcare Guarantee”
[12] Department for Work & Pensions, “The Employment of Disabled People 2024”
[13] Office for National Statistics, “Annual Population Survey”
[14] Joseph Rowntree Foundation, “UK Poverty 2024: The Essential Guide to Understanding Poverty in the UK”
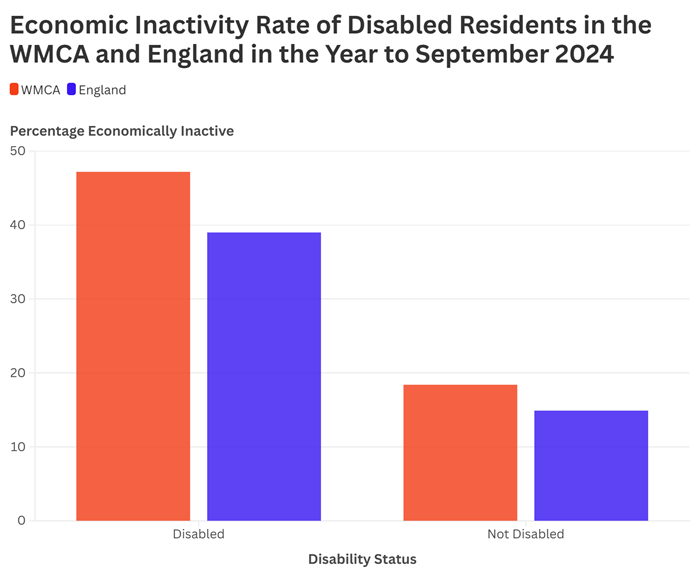
Figure 18: A grouped bar chart showing economic inactivity rate of disabled and non-disabled residents in the WMCA and England in the year to September 2024, with the WMCA higher for both groups, and more so for disabled residents
Another societal group who are at a disadvantage when accessing stable, well-paid jobs are disabled people. The Equality Act 2010 defines disability as having a “physical or mental impairment that has a ‘substantial’ and ‘long-term’ negative effect on your ability to do normal daily activities”.[1] The relationship between disability and poverty is profound, with the Joseph Rowntree Foundation reporting that more than half of the families living in poverty in 2024 contained someone who was disabled.[2] The disability pay gap in the West Midlands region was estimated to be 17.7% in 2023, the highest it has been since before 2014 and 5pp higher than the 12.7% average for the UK. This is also the largest pay gap of any region in England.[3] Not only do disabled people get paid less than non-disabled people, a disabled household also faces spending an estimated £1,010 ‘Disability Price Tag’ a month just to attain the same standard of living as a non-disabled household in 2023 according to Scope.[4] They also reported that this represented around 67% of the average household income after housing costs. Pupils with special educational needs (SEN) in the WMCA area achieve lower academic attainment than their peers, with more than three times as many 16-17 year olds with SEN being NEET. As a result, these pupils often leave school less qualified, presenting a barrier limiting their future earnings potential.
Disabled residents in the WMCA area with mobility issues have to contend with a housing supply where 28% of homes cannot meet accessibility standards.[5] Disabled residents are three times as likely to live in social rented housing as non-disabled residents, meaning that the need for these homes to be accessible is high. A larger than average proportion of adults living in the WMCA area are not living in stable and appropriate accommodation at 24% compared to 19% nationally.
The proportion of people living in non-decent housing also varied by ethnicity, with Black British, African or Caribbean residents in England particularly impacted, at 17.9% living in non-decent housing, 3.5pp more than White residents.[6] The proportion of people living in overcrowded homes also varied considerably, with 2% of White British households deemed to be overcrowded compared to 24% of Bangladeshi households, the most of any ethnic group. Research suggests that institutional racism in the UK could be contributing to ethnic minority homebuyers and tenants living in substandard accommodation, with Black and Asian people almost five times as likely to experience discrimination when looking for a home than White people.[7] Ethnic minorities are also disproportionately impacted by homelessness.[8] Of the 17,310 households deemed to be owed a homelessness duty in the WMCA area in the year to March 2024, 57% were non-white, despite only 39% of the population being non-white. In particular Black British, Caribbean or African applicants made up a significantly large proportion of those owed a duty at 18%, despite only making up 8% of the population.
Unemployment rates vary considerably between different ethnic groups in the WMCA area. In the year to September 2024, 4.5% of White residents were unemployed, the least of any group, compared to 10.7% of Black or Black British residents, the most of any group.
[1] UK Government, “Definition of Disability under Equality Act 2010”
[2] Joseph Rowntree Foundation, “Unlocking Benefits: Tackling Barriers for Disabled People Wanting to Work”
[3] Office for National Statistics, “Raw Disability Pay Gaps, UK”
[4] Scope, “Disability Price Tag 2024”
[5] West Midlands Combined Authority, “Making the West Midlands an Exemplary Region for Disabled People”
[6] Ministry of Housing, Communities and Local Government, “English Housing Survey 2023 to 2024: Headline Findings on Housing Quality and Energy Efficiency”
[7] Shelter, “The Fight for Home Is a Fight Against Racism”
[8] Ministry of Housing, Communities and Local Government, “Statutory Homelessness in England: Financial Year 2023–24”
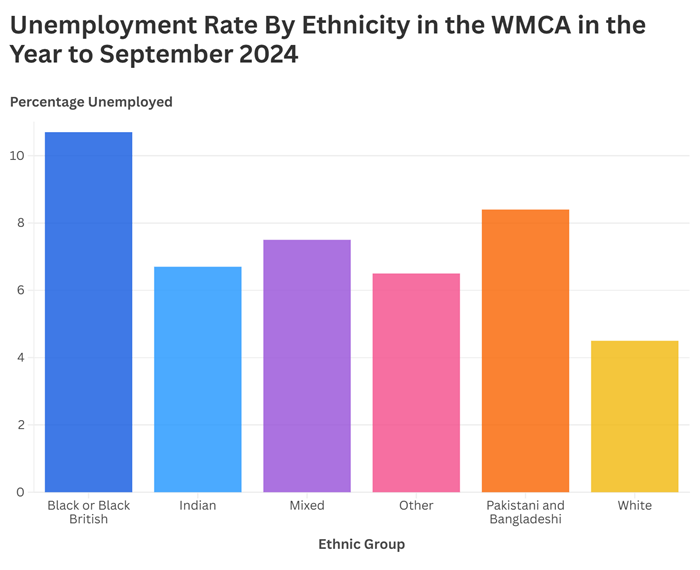
Figure 19: A bar chart showing the unemployment rate by ethnicity in the WMCA in the year to September 2024, with Black or Black British residents at the highest level and White residents at the lowest
Not only do ethnic minority residents face additional barriers when finding housing, they also spend a larger share of their income on housing than White British households.[1] The Resolution Foundation found that White British adults in Britain spend an average of 11% of their income on housing, whilst Bangladeshi, Black Other, and Arab adults spend far more, at 23%, 24% and 26% respectively in 2021/22-2022/23. As a result, these residents have a lower proportion of their income left over to spend on other necessities. The Social Market Foundation found that car ownership and usage presents the most expensive mode of transport, costing the median British household £5,740 a year.[2] Unsurprisingly, ethnic minorities were less likely to live in a household with a car or van than White residents in England, with only 16% of White residents without access, compared to 34% of Mixed, and 30% of Black residents.[3] 53.1% of residents in the WMCA area said that they would find it difficult to travel to work without a private vehicle in 2022, meaning that these residents who lack access to a van or car are likely to be more limited by employment opportunities.[4]
Different groups of society have very different outcomes regarding basic needs such as pay, employment, housing and more. Residents who are male, White British, and non-disabled tend to experience negative outcomes less, with people with multiple intersecting underprivileged characteristics facing more barriers.
Traditionally there is a focus on pay and employment, with pay gap reporting often receiving considerable media attention. Searching beyond this helps us to understand why these disparities exist, and where we can focus our efforts to address them. For each societal group, the factors that influence their outcomes are complex and multifaceted. For women, a prominent cause is motherhood, and societal expectations on mothers to bear the brunt of caring responsibilities, which results in a broader impact on the economic decisions women make and the opportunities available. Ethnic minorities is an umbrella term, with different ethnic groups experiencing very different challenges, but systemic racism and deprivation are common barriers to enjoying a good quality of life. Disability also comes in many forms, with different groups having varied needs when participating in society. Due to the complexity of the challenges faced by different societal groups, it is very important to consider all potential barriers to participation when developing interventions. We must also consider how to include a diverse range of residents in decision-making.
The broad range of topics covered in this report demonstrates how complex and interconnected the different aspects of our economy and our residents’ lives are. Whilst we use the eight fundamentals of inclusive growth as separate lenses to view these issues through, it is clear that they each interact with each other, with a change made in any one area influencing outcomes in the others. Understanding these relationships, we must assess each policy area’s contribution to this system and the broad impact our work can have. This supports us to identify where we can influence other areas through more considered development and delivery. Through this, we can collaborate better with those working in areas we can influence, sharing our specialist knowledge and investing public money more effectively and efficiently. The benefits of this can be profound, with the potential to develop programmes with broader scopes resulting in richer outcomes.
Inclusive growth is a useful mechanism to facilitate collaboration across the divides of government, but we can also extend our network beyond our own organisation. We can engage with and include local residents in the process, utilising their lived experiences and knowledge of their community to understand and tackle challenging problems. No one can understand these issues better than those who are encountering them in their daily lives, and so engaging with residents as early in the policy development process as possible strengthens our approach. This not only improves the outcomes of programmes, but it also develops residents’ trust in authorities and encourages them to participate and contribute to their community. Co-design is an under-utilised opportunity that we must employ where possible.
This report only represents an overview of some key issues in our economy, demonstrating the challenges that persist in the West Midlands and providing evidence for how inclusive growth can aid us in addressing them. Many of these issues are too complex to address through a single themed approach, and so we cannot ever hope to deliver change without leveraging our relationships with all those holding a stake in our area. The evidence in this report can help us to identify the issues we can influence, and inclusive growth provides us with a framework to measure our impact so that we can deliver innovative solutions for our residents.
[1] Resolution Foundation, “Heritage and Home”
[2] Social Market Foundation, “Getting the Measure of Transport Poverty”
[3] Department for Transport, “Travel by vehicle availability, income, ethnic group, household type, mobility status and NS-SEC”
[4] Health Foundation, “Inequalities in Who Relies on a Private Vehicle to Travel to Work”
Action on Smoking and Health. "Cost of Smoking in England Up 25% to £21.8 Billion." https://ash.org.uk/media-centre/news/press-releases/latest-figures-show-cost-of-smoking-in-england-up-25-to-at-least-21-8-billion
Alexandra Starr, Zainab F. Haider, and Sophie von Stumm. “Do School Grades Matter for Growing Up? Testing the Predictive Validity of School Performance for Outcomes in Emerging Adulthood.” Developmental Psychology 60, no. 4 (2024): 665–679. https://doi.org/10.1037/dev0001548
André Dua et al. “The Case for Inclusive Growth.” McKinsey & Company, April 2021. https://www.mckinsey.com/~/media/mckinsey/industries/public%20and%20social%20sector/our%20insights/the%20case%20for%20inclusive%20growth/the-case-for-inclusive-growth-web-final.pdf
Andre Neves, and Christian Brand. “Assessing the Potential for Carbon Emissions Savings from Replacing Short Car Trips with Walking and Cycling Using a Mixed GPS-Travel Diary Approach.” Transportation Research Part A: Policy and Practice 123 (2019): 130–146. https://doi.org/10.1016/j.tra.2018.08.022
Andrea Mazzeo, et al. “Modelling the Impact of National vs. Local Emission Reduction on PM2.5 in the West Midlands, UK Using WRF-CMAQ.” Atmosphere 13, no. 3 (2022): 377. https://doi.org/10.3390/atmos13030377
Antonio Gasparrini et al. “Small-Area Assessment of Temperature-Related Mortality Risks in England and Wales: A Case Time Series Analysis.” The Lancet Planetary Health 6, no. 7 (July 2022): e557–e564. https://www.thelancet.com/journals/lanplh/article/PIIS2542-5196(22)00138-3
Bardia Mashhoodi. “Who is more dependent on gas consumption? Income, gender, age, and urbanity impacts.” Applied Geography 137 (2021): 102602. https://www.sciencedirect.com/science/article/pii/S0143622821002186
Bastian Herre and Pablo Arriagada. “Homelessness.” Our World in Data. https://ourworldindata.org/homelessness
Become Charity. "Regional Statistics About the Care System." https://becomecharity.org.uk/regional-statistics-about-the-care-system/
Betsy Lake and David W. Maidment. “Is This a New Dawn for Accessibility? A Qualitative Interview Study Assessing Remote Working Experiences in Adults with Physical Disabilities Post COVID-19.” Work 75, no. 3 (2023): 779–792. https://doi.org/10.3233/WOR-220622
Caroline E. Jenkinson et al. “Is Volunteering a Public Health Intervention? A Systematic Review and Meta-Analysis of the Health and Survival of Volunteers.” BMC Public Health 13, no. 773 (2013). https://link.springer.com/article/10.1186/1471-2458-13-773
Centre for Mental Health. “The Economic and Social Costs of Mental Ill Health.” March 2024. https://www.centreformentalhealth.org.uk/wp-content/uploads/2024/03/CentreforMH_TheEconomicSocialCostsofMentalIllHealth.pdf
Child Poverty Action Group. "How School Costs Make It Harder to Go to School." https://cpag.org.uk/news/how-school-costs-make-it-harder-go-school
City-REDI, University of Birmingham. “West Midlands Economic Impact Monitor – 30 May 2024.” https://blog.bham.ac.uk/cityredi/west-midlands-economic-impact-monitor-30-may-2024/
City-REDI, University of Birmingham. “What Is Gross Value Added (GVA)?” City-REDI Blog. https://blog.bham.ac.uk/cityredi/what-is-gross-value-added-gva/
City-REDI. “Uneven Rise in Economic Inactivity: A Growing Concern for the West Midlands.” University of Birmingham, 2024. https://blog.bham.ac.uk/cityredi/uneven-rise-in-economic-inactivity-a-growing-concern-for-the-west-midlands/
Claudia Chwalisz. “Citizen Engagement in Politics and Policymaking: Lessons from the UK.” Populus and Westminster Foundation for Democracy, April 2017. https://oidp.net/docs/repo/doc214.pdf
Cristina Leston-Bandeira. "Parliamentary petitions and public engagement: an empirical analysis of the role of e-petitions." University of Leeds. https://eprints.whiterose.ac.uk/145393/3/Role_Parliamentary_Petitions_Systems_CLB_COMBIN
Dan Lewer et al. “Health-Related Quality of Life and Prevalence of Six Chronic Diseases in Homeless and Housed People: A Cross-Sectional Study in London and Birmingham, England.” BMJ Open 9, no. 4 (2019): e025192. https://bmjopen.bmj.com/content/9/4/e025192
Daniel Stockemer. “What Affects Voter Turnout? A Review Article/Meta-Analysis of Aggregate Research.” Government and Opposition 41, no. 2 (2006): 193–219. https://www.cambridge.org/core/journals/government-and-opposition/article/what-affects-voter-turnouta-review-articlemetaanalysis-of-aggregate-research/2CCC1F9A8B742953B2D10C87C13D9F12
Daphne Vanleene, Bram Verschuere, and Joris Voets. Benefits and Risks of Co-Production: A Preliminary Literature Review. Paper presented at the IIAS Conference on Co-Production of Public Services, Nijmegen, June 2015. https://core.ac.uk/download/pdf/55783288.pdf
Department for Business, Energy & Industrial Strategy. “Research into the Behaviours and Attitudes of the Fuel Poor in England.” https://assets.publishing.service.gov.uk/media/5a82e0c7ed915d74e3404060/Research_into_the_Behaviours_and_Attitudes_of_the_Fuel_Poor_in_England_Report_Final.pd
Department for Culture, Media and Sport. “Community Life Survey 2023/24 Annual Publication.” Community Life Survey. Published December 4, 2024. https://www.gov.uk/government/statistics/community-life-survey-202324-annual-publication
Department for Education. "Apprenticeships 2023–24." https://explore-education-statistics.service.gov.uk/find-statistics/apprenticeships/2023-24
Department for Education. "Investment in Training.” https://explore-education-statistics.service.gov.uk/data-tables/permalink/70a6d721-328f-4be4-f8a4-08dd50ab90d0
Department for Education. "Key stage 4 performance." https://explore-education-statistics.service.gov.uk/data-tables/permalink/93715d2a-e6b3-4f8b-0e39-08dd5ccbf23a
Department for Education. "Participation in education, training and NEET age 16 to 17 by local authority." https://explore-education-statistics.service.gov.uk/data-tables/permalink/48d9abda-d97e-422c-9b7e-08dd7377d1ad
Department for Education. "Pupil Absence in Schools in England." https://explore-education-statistics.service.gov.uk/find-statistics/pupil-absence-in-schools-in-england
Department for Education. "Widening participation in higher education." https://explore-education-statistics.service.gov.uk/data-tables/permalink/628c5b08-bef1-4781-f162-08dd5cc661f7
Department for Education. “Employer Skills Survey 2022.” https://www.gov.uk/government/statistics/employer-skills-survey-2022
Department for Education. “GCSE Attainment and Lifetime Earnings.” https://assets.publishing.service.gov.uk/media/60c36f0cd3bf7f4bd11a2326/GCSE_Attainment_and_Lifetime_Earnings_PDF3A.pdf
Department for Education. “Labour Market and Skills Projections 2020 to 2035.” https://www.gov.uk/government/publications/labour-market-and-skills-projections-2020-to-2035
Department for Education. “Labour Market Value of Higher and Further Education Qualifications: A Summary Report.” https://www.gov.uk/government/publications/labour-market-value-of-higher-and-further-education-qualifications-a-summary-report
Department for Education. “Why Is School Attendance So Important and What Are the Risks of Missing a Day?” The Education Hub, 18 May 2023. https://educationhub.blog.gov.uk/2023/05/school-attendance-important-risks-missing-day/
Department for Energy Security & Net Zero. “Sub-regional Fuel Poverty in England, 2025 Report (2023 Data).” Published 30 April 2025. https://www.gov.uk/government/statistics/sub-regional-fuel-poverty-report-2025-2023-data
Department for Energy Security and Net Zero. “Regional and Local Authority Gas Consumption Statistics.” https://www.gov.uk/government/statistics/regional-and-local-authority-gas-consumption-statistics
Department for Energy Security and Net Zero. “UK Local Authority and Regional Greenhouse Gas Emissions Statistics: 2005 to 2022.” Last updated June 27, 2024. https://www.gov.uk/government/statistics/uk-local-authority-and-regional-greenhouse-gas-emissions-statistics-2005-to-2022
Department for Environment, Food & Rural Affairs. “Air Quality Statistics: ENV02 Dataset.” https://www.gov.uk/government/statistical-data-sets/env02-air-quality-statistics
Department for Environment, Food & Rural Affairs. “Local Authority Collected Waste Management – Annual Results.” Waste and recycling statistics. Last updated March 27, 2025. https://www.gov.uk/government/statistics/local-authority-collected-waste-management-annual-results
Department for Levelling Up, Housing and Communities. “English Housing Survey: 2022 to 2023 Energy Report.” English Housing Survey. https://www.gov.uk/government/statistics/english-housing-survey-2022-to-2023-energy/english-housing-survey-2022-to-2023-energy-report
Department for Transport. “National Travel Survey 2022.” https://www.gov.uk/government/statistics/national-travel-survey-2022/national-travel-survey-2022-mode-share-journey-lengths-and-trends-in-public-transport-use
Department for Transport. “People with Non-Visible Impairments: Attitudes to and Experiences of Transport.” Social, behavioural and evaluation research. https://www.gov.uk/government/publications/people-with-non-visible-impairments-attitudes-to-and-experiences-of-transport/de8b1248-d605-419d-9e60-0e57e4b89972
Department for Transport. “Transport and Environment Statistics 2023 (2021 data).” GOV.UK. https://www.gov.uk/government/statistics/transport-and-environment-statistics-2023/transport-and-environment-statistics-2023
Department for transport. “Travel by vehicle availability, income, ethnic group, household type, mobility status and NS-SEC.” National Travel Survey. https://www.gov.uk/government/statistical-data-sets/nts07-car-ownership-and-access
Department for Transport. “Walking and Cycling Statistics.” https://www.gov.uk/government/statistical-data-sets/walking-and-cycling-statistics-cw
Department for Work & Pensions. “The Employment of Disabled People 2024.” https://www.gov.uk/government/statistics/the-employment-of-disabled-people-2024/the-employment-of-disabled-people-2024
Department of Health and Social Care. "Government Plans to Tackle Obesity in England." https://healthmedia.blog.gov.uk/2023/06/07/government-plans-to-tackle-obesity-in-england/
Department of Health and Social Care. "Smoking Ban Introduced to Protect Children and Most Vulnerable." https://www.gov.uk/government/news/smoking-ban-introduced-to-protect-children-and-most-vulnerable
Dirk Nelen. "Environmental and Socio-Economic Impacts of Landfills." ResearchGate. https://www.researchgate.net/profile/Dirk-Nelen/publication/278738702_Environmental_and_socio-economic_impacts_of_landfills/links/58ff795345851565029f290a/Environmental-and-socio-economic-impacts-of-landfills.pdf
Dudley Metropolitan Borough Council. “Heatwave Briefing: November 2022.” https://www.allaboutdudley.info/wp-content/uploads/sites/2/2022/11/Heatwave-Briefing-Nov-2022.pdf
Elise Uberoi, Johnston, Neil. “Political disengagement in the UK: Who is disengaged?” https://researchbriefings.files.parliament.uk/documents/CBP-7501/CBP-7501.pdf
Ellen MacArthur Foundation. "What Is the Linear Economy?" https://www.ellenmacarthurfoundation.org/what-is-the-linear-economy
Equality and Human Rights Commission. “The Ethnicity Pay Gap: Executive Summary.” Research Report 108. 2022. https://www.equalityhumanrights.com/sites/default/files/2022/our-work-research-report-108-the-ethnicity-pay-gap-executive-summary.pdf.
Financial Times. “Inequality Hasn’t Risen. Here’s Why It Feels Like It Has.” Financial Times, January 2, 2025. https://www.ft.com/content/b325af8f-1864-448e-9b3e-bd1a18333a08
Gergő Baranyi, Chris Dibben, and Jamie Pearce. “Neighbourhood Effects on Mental Health: A Systematic Review and Meta-Analysis.” University of Edinburgh, 2021. https://www.pure.ed.ac.uk/ws/files/213428583/281._Baranyi._Dibben._Pearce..pdf
Gianni De Fraja, Sara Lemos, and James C. Rockey. “The Wounds That Do Not Heal: The Lifetime Scar of Youth Unemployment.” Economica 88, no. 352 (2021): 896–941. https://doi.org/10.1111/ecca.12384
Good Things Foundation. “Solve Digital Exclusion and the Cost-of-Living Crisis.” https://www.goodthingsfoundation.org/policy-and-research/research-and-evidence/research-2024/solve-digital-exclusion-cost-of-living-crisis.html
Hansen, Frederik Godt. “How Government Efficiency Shapes Political Trust: Evidence from the Case of Brexit.” British Journal of Political Science 54, no. 3 (2024): 957–968. https://www.cambridge.org/core/journals/british-journal-of-political-science/article/how-government-efficiency-shapes-political-trust-evidence-from-the-case-of-brexit/EA7B183CB9413EA2F6C175D25054E553
Health Foundation. "Inequalities in Concentration of Fast Food Outlets." https://www.health.org.uk/evidence-hub/our-surroundings/access-to-amenities/inequalities-in-concentration-of-fast-food
Health Foundation. "Relationship Between Access to Green Space and Health." https://www.health.org.uk/evidence-hub/our-surroundings/green-space/relationship-between-access-to-green-space-and-health
Health Foundation. "Relationship Between Air Pollution and Health." https://www.health.org.uk/evidence-hub/our-surroundings/air-pollution/relationship-between-air-pollution-and-health
Health Foundation. "Relationship Between the Concentration of Fast Food Outlets and Health." https://www.health.org.uk/evidence-hub/our-surroundings/access-to-amenities/relationship-between-the-concentration-of-fast
Health Foundation. “Health Benefits of Walking and Cycling.” https://www.health.org.uk/evidence-hub/transport/active-travel/health-benefits-of-walking-and-cycling-preventable-early
Health Foundation. “Inequalities Between Groups of People Living in Non-Decent Homes.” https://www.health.org.uk/evidence-hub/housing/housing-quality/inequalities-between-groups-of-people-living-in-non-decent
Health Foundation. “Inequalities in Likelihood of Living in High-Crime Neighbourhoods.” https://www.health.org.uk/evidence-hub/our-surroundings/safety/inequalities-in-likelihood-of-living-in-high-crime
Health Foundation. “Inequalities in Who Relies on a Private Vehicle to Travel to Work.” https://www.health.org.uk/evidence-hub/transport/social-exclusion/inequalities-in-who-relies-on-a-private-vehicle-to-travel
Health Foundation. “Proportion of People in Low-Quality Work by Region, Ethnicity, Age and Sex.” https://www.health.org.uk/evidence-hub/work/job-quality/proportion-of-people-in-low-quality-work-by-region-ethnicity-age-and
Health Foundation. “Relationship Between Living in Overcrowded Homes and Mental Health.” https://www.health.org.uk/evidence-hub/housing/housing-stability-and-security/relationship-between-living-in-overcrowded
Health Foundation. “Transport Problems When Travelling to Work.” https://www.health.org.uk/evidence-hub/transport/social-exclusion/transport-problems-when-travelling-to-work
HM Revenue & Customs. “Tobacco Statistics Commentary: April 2024.” Tobacco Bulletin. https://www.gov.uk/government/statistics/tobacco-bulletin/tobacco-statistics-commentary-april-2024
House of Commons Library. “2024 General Election: Turnout.” Last updated September 5, 2024. https://commonslibrary.parliament.uk/general-election-2024-turnout/
House of Commons Library. “Who Stood in the 2024 General Election?” Published July 4, 2024. https://commonslibrary.parliament.uk/who-stood-in-the-2024-general-election/
House of Lords Citizenship and Civic Engagement Committee. “Oral Evidence: Local Communities.” https://data.parliament.uk/writtenevidence/committeeevidence.svc/evidencedocument/citizenship-and-civic-engagement-committee/citizenship-and-civic-engagement/oral/75066.html
House of Lords Library. “Causes of Youth Unemployment: Lords Committee Report.” https://lordslibrary.parliament.uk/causes-of-youth-unemployment-lords-committee-report/
House of Lords Select Committee on Citizenship and Civic Engagement. “Chapter 6: Democratic Engagement – Improving Connectivity” The Ties That Bind: Citizenship and Civic Engagement in the 21st Century. HL Paper 118. April 2018. https://publications.parliament.uk/pa/ld201719/ldselect/ldcitizen/118/11809.htm
IPPR. Who Is Losing Learning? The Case for Reducing Exclusions across Mainstream Schools. Institute for Public Policy Research, September 2024. https://www.ippr.org/articles/who-is-losing-learning
John N. Newton. “Counting Early Deaths Due to Socioeconomic Inequality.” The Lancet Public Health 5, no. 6 (2020): e314. https://doi.org/10.1016/S2468-2667(19)30242-7
Joseph Rowntree Foundation. “The Effect of Occupation on Poverty Among Ethnic Minority Groups.” https://www.jrf.org.uk/race-and-ethnicity/the-effect-of-occupation-on-poverty-among-ethnic-minority-groups
Joseph Rowntree Foundation. “UK Poverty 2024: The Essential Guide to Understanding Poverty in the UK.” https://www.jrf.org.uk/uk-poverty-2024-the-essential-guide-to-understanding-poverty-in-the-uk
Joseph Rowntree Foundation. “Unlocking Benefits: Tackling Barriers for Disabled People Wanting to Work.” https://www.jrf.org.uk/work/unlocking-benefits-tackling-barriers-for-disabled-people-wanting-to-work
Laura Pimpin et al. “Estimating the Costs of Air Pollution to the National Health Service and Social Care: An Assessment and Forecast up to 2035.” PLOS Medicine 15, no. 7 (2018): e1002602. https://doi.org/10.1371/journal.pmed.1002602
Leah Millthorne, Victoria Bettany, Tallulah Eyres, Sara Reis, Lisa Adamson, and Sarah Longlands. Women’s Work: How Gender Equality Can Deliver Stronger Local Economies. Centre for Local Economic Strategies (CLES), March 2024. https://cles.org.uk/wpcontent/uploads/2024/03/Womens-Work.pdf
Lloyds Bank. “Consumer Digital Index 2020.” https://www.lloydsbank.com/assets/media/pdfs/banking_with_us/whats-happening/211109-lloyds-consumer-digital-index-2020-eds.pdf.
Lloyds Bank. “Consumer Digital Index 2024.” https://www.lloydsbank.com/assets/media/pdfs/banking_with_us/whats-happening/lb-consumer-digital-index-2024-report.pdf.
Local Government Association. “Local Election Turnout.” https://reports.esd.org.uk/search/3361?text=local%20election%20turnout
Local Government Association. “Overcrowding.” https://reports.esd.org.uk/search/3172?text=overcrowding
Local Government Association. “Percentage of the Working Age Population by Employment Status.” https://reports.esd.org.uk/search/%5b198_PercentageOfTheWorkingAgePopulation%5d%5bEmploymentstatus%5d?text=employment+rate.
Local Government Association. Regional Polling Results. https://www.local.gov.uk/our-support/research-and-data/research-publications/regional-polling-results
Local Government Information Unit. "The Core Principles of Trust Applied to Local Government." October 2023. https://lgiu.org/blog-article/the-core-principles-of-trust-applied-to-local-government/
Majid Mahmood. “We’ve published our climate adaptation strategy for the West Midlands.” X, May 29, 2024. https://x.com/CllrMajid/status/1865501307584295275
Met Office. “Summer and winter changes by the 2070s.” UKCP18 Climate Change Over Land. https://www.metoffice.gov.uk/binaries/content/assets/metofficegovuk/pdf/research/ukcp/ukcp18-infographic-headline-findings-land.pdf
Mhairi Bowe et al. “A Social Cure in the Community: A Mixed‐Method Exploration of the Role of Social Identity in the Experiences and Well‐Being of Community Volunteers.” European Journal of Social Psychology 51, no. 4–5 (2021): 667–684. https://onlinelibrary.wiley.com/doi/full/10.1002/ejsp.2706https://onlinelibrary.wiley.com/doi/full/10.1002/ejsp.2706
Ministry of Housing, Communities and Local Government. “A Decent Home: Definition and Guidance.” https://www.gov.uk/government/publications/a-decent-home-definition-and-guidance
Ministry of Housing, Communities and Local Government. “English Housing Survey 2023 to 2024: Headline Findings on Housing Quality and Energy Efficiency.” https://www.gov.uk/government/collections/english-housing-survey-2023-to-2024-headline-findings-on-housing-quality-and-energy-efficiency
Ministry of Housing, Communities and Local Government. “English Housing Survey 2022 to 2023: Housing Quality and Condition.” https://www.gov.uk/government/statistics/english-housing-survey-2022-to-2023-housing-quality-and-condition/english-housing-survey-2022-to-2023-housing-quality-and-condition
Ministry of Housing, Communities and Local Government. “Evidence Review of the Costs of Homelessness.” https://assets.publishing.service.gov.uk/government/uploads/system/uploads/attachment_data/file/7596/2200485.pdf
Ministry of Housing, Communities and Local Government. “Homelessness Data: Notes and Definitions.” https://www.gov.uk/guidance/homelessness-data-notes-and-definitions
Ministry of Housing, Communities and Local Government. “Homelessness: Rapid Evidence Assessment.” https://assets.publishing.service.gov.uk/media/5cab2a5040f0b6752a407311/Homelessness_-_REA.pdf
Ministry of Housing, Communities and Local Government. “Statutory Homelessness in England: Financial Year 2023–24.” Homelessness Statistics. https://www.gov.uk/government/statistics/statutory-homelessness-in-england-financial-year-2023-24
Motability Foundation. “Building a Better Understanding of the Transport Lives of Disabled People: Research Summary.” https://www.motabilityfoundation.org.uk/media/k3xlfrek/research_summary_building_a_better_understanding_of_the_transport_lives_of_disabled_people_motability-1.pdf
Nagina Khan, et al. “Diversity, Community Engagement and Co-Design in Research: A Rapid Review.” BMJ Leader, published online November 27, 2024. https://bmjleader.bmj.com/content/early/2024/11/27/leader-2024-001046
Naomi Clayton, and Maire Williams. “Delivering Change: Cities and the Youth Unemployment Challenge.” https://www.centreforcities.org/reader/delivering-change-cities-youth-unemployment-challenge/introduction/
National Grid. “What Is Net Zero?” https://www.nationalgrid.com/stories/energy-explained/what-is-net-zero
National Housing Federation. “Overcrowding in England 2023.” https://www.housing.org.uk/resources/overcrowding-in-england-2023/
Neil Lee and Paul Sissons. “Inclusive Growth? The Relationship Between Economic Growth and Poverty in British Cities.” Environment and Planning A: Economy and Space (Accepted version), London School of Economics, 2016. https://eprints.lse.ac.uk/66806/1/Lee_Inclusive_growth.pdf
Nuffield Foundation. "Progression from GCSEs Not Working for Many Young People." https://www.nuffieldfoundation.org/news/progression-from-gcses-not-working-for-many-young-people-new-research-finds
Nuffield Trust. "What Is the Scale of the Challenge to Address Health Inequalities Affecting Children and Young People?" https://www.nuffieldtrust.org.uk/news-item/what-is-the-scale-of-the-challenge-to-address-health-inequalities-affecting-children-and-young-people
Office for National Statistics. "Level 3 or Above Qualifications." https://explore-local-statistics.beta.ons.gov.uk/indicators/level-3-or-above-qualifications
Office for National Statistics. “Annual personal well-being estimates.” https://www.ons.gov.uk/peoplepopulationandcommunity/wellbeing/datasets/headlineestimatesofpersonalwellbeing
Office for National Statistics. “Annual Population Survey”. Nomis. https://www.nomisweb.co.uk/datasets/apsnew
Office for National Statistics. “Business Demography, UK.” https://www.ons.gov.uk/businessindustryandtrade/business/activitysizeandlocation/datasets/businessdemographyreferencetable
Office for National Statistics. “Business Dynamism in the UK Economy: Quarter 1 (Jan to Mar) 1999 to Quarter 4 (Oct to Dec) 2019.” https://www.ons.gov.uk/businessindustryandtrade/changestobusiness/businessbirthsdeathsandsurvivalrates/bulletins/businessdynamismintheukeconomy/quarter1jantomar1999toquarter4octtodec2019
Office for National Statistics. “Climate Change Insights, Families and Households, UK: August 2023.” https://www.ons.gov.uk/economy/environmentalaccounts/articles/climatechangeinsightsuk/august2023
Office for National Statistics. “Full-Time, Part-Time and Temporary Workers, Seasonally Adjusted.” https://www.ons.gov.uk/employmentandlabourmarket/peopleinwork/employmentandemployeetypes/datasets/fulltimeparttimeandtemporaryworkersseasonallyadjustedemp01sa
Office for National Statistics. “Gender Pay Gap.” https://www.ons.gov.uk/employmentandlabourmarket/peopleinwork/earningsandworkinghours/datasets/annualsurveyofhoursandearningsashegenderpaygaptables
Office for National Statistics. “Healthy Life Expectancy in England and Wales: 2011 to 2013 and 2021 to 2023.” https://www.ons.gov.uk/peoplepopulationandcommunity/healthandsocialcare/healthandlifeexpectancies/bulletins/healthstatelifeexpectanciesuk/between2011to2013and2021to2023
Office for National Statistics. “Personal well-being in the UK: April 2022 to March 2023.” https://www.ons.gov.uk/peoplepopulationandcommunity/wellbeing/bulletins/measuringnationalwellbeing/latest
Office for National Statistics. “Private Rental Affordability, England and Wales.” https://www.ons.gov.uk/peoplepopulationandcommunity/housing/datasets/privaterentalaffordabilityengland
Office for National Statistics. “Raw Disability Pay Gaps, UK.” https://www.ons.gov.uk/peoplepopulationandcommunity/healthandsocialcare/disability/datasets/rawpaygapsbydisability
Office for National Statistics. “Trust in Government, UK: 2023.” https://www.ons.gov.uk/peoplepopulationandcommunity/wellbeing/bulletins/trustingovernmentuk/2023.
Peter C. Slorach, Jeswani, Harish K., Cuéllar-Franca, Rosa, Azapagic, Adisa “Assessing the economic and environmental sustainability of household food waste management in the UK: Current situation and future scenarios” Science of The Total Environment 710 (2020): 135580. https://www.sciencedirect.com/science/article/pii/S0048969719355755.
Phil Mason, Ade Kearns, and Mark Livingston. “'Safe Going': The Influence of Crime Rates and Perceived Crime and Safety on Walking in Deprived Neighbourhoods.” Social Science & Medicine 91 (August 2013): 15–24. https://doi.org/10.1016/j.socscimed.2013.04.011
Public Health England. “Health Matters: Smoking and Quitting in England.” https://www.gov.uk/government/publications/health-matters-smoking-and-quitting-in-england/smoking-and-quitting-in-england
Public Health England. “Homelessness: Applying All Our Health.” https://www.gov.uk/government/publications/homelessness-applying-all-our-health/homelessness-applying-all-our-health
Public Health England. “Life Expectancy in the West Midlands.” https://fingertips.phe.org.uk/static-reports/health-trends-in-england/west_midlands/life_expectancy.html
Public Health England. “Smoking in the West Midlands.” https://fingertips.phe.org.uk/static-reports/health-trends-in-england/West_Midlands/smoking.html
PwC. “Women in Work 2025.” https://www.pwc.co.uk/economic-services/assets/women-in-work-2025.pdf
PwC. Women in Work Index 2023. 2023. https://www.pwc.co.uk/economic-services/WIWI/pwc-women-in-work-index-2023.pdf
Rachel Statham, Henry Parkes, and Shreya Nanda. “Towards a Childcare Guarantee.” Institute for Public Policy Research. https://ippr-org.files.svdcdn.com/production/Downloads/towards-a-childcare-guarantee-sept-22.pdf
Resolution Foundation. “Are Universities Worth It?” https://www.resolutionfoundation.org/publications/are-universities-worth-it/
Resolution Foundation. “Heritage and Home.” https://www.resolutionfoundation.org/publications/heritage-and-home/
Richard A. Sharpe, Christopher R. Thornton, Vasilis Nikolaou, and Nicholas J. Osborne. “Fuel Poverty Increases Risk of Mould Contamination, Regardless of Adult Risk Perception & Ventilation in Social Housing Properties.” Environment International 79 (2015): 115–129. https://doi.org/10.1016/j.envint.2015.03.009
Robert W. Aldridge et al. “Causes of Death among Homeless People: A Population-Based Cross-Sectional Study of Linked Hospitalisation and Mortality Data in England.” Wellcome Open Research 4 (2019): 49. https://wellcomeopenresearch.org/articles/4-49
Sarah Beadle. “Single Mothers’ Experiences of Temporary Accommodation: a Suffolk-based Study.” Doctoral thesis, University of Hertfordshire, 2022. https://uhra.herts.ac.uk/id/eprint/15848/
Scope. “Disability Price Tag 2024.” https://www.scope.org.uk/campaigns/disability-price-tag
Shelter. “Homelessness Bill Doubles in Five Years to £2.3bn.” https://england.shelter.org.uk/media/press_release/homelessness_bill_doubles_in_five_years_to_2_3bn
Shelter. “The Fight for Home Is a Fight Against Racism.” https://england.shelter.org.uk/the_fight_for_home_is_a_fight_against_racism
Sheng Yang et al. “Trends on PM2.5 Research, 1997–2016: A Bibliometric Study.” Environmental Science and Pollution Research 25, no. 12 (2018): 12284–12298. https://doi.org/10.1007/s11356-018-1723-x
Social Market Foundation. “Getting the Measure of Transport Poverty.” November 2023. https://www.smf.co.uk/wp-content/uploads/2023/11/Getting-the-measure-of-transport-poverty-Nov-2023.pdf
Solihull Metropolitan Borough Council. “Health Equalities Assessment of the Housing Strategy.” https://www.solihull.gov.uk/sites/default/files/2023-03/Health-Equalities-Assessment-Housing-Strategy.pdf
Sondès Kahouli. “An Economic Approach to the Study of the Relationship between Housing Hazards and Health: The Case of Residential Fuel Poverty in France.” Energy Economics 85 (January 2020): 104592. https://doi.org/10.1016/j.eneco.2019.104592
Susann Weihrauch-Blüher, and Susanna Wiegand. “Risk Factors and Implications of Childhood Obesity.” Current Obesity Reports 7, no. 4 (2018): 254–259. https://doi.org/10.1007/s13679-018-0320-0
The Equality Trust. “Cost of Inequality 2023.” https://media.equality-trust.out.re/uploads/2023/11/ReportCostofInequality-1.pdf
Todd Litman. “Transportation Affordability: Evaluation and Improvement Strategies.” Victoria Transport Policy Institute, 2009. https://www.researchgate.net/profile/Todd-Litman-2/publication/37183850_Transportation_Affordability_evaluation_and_improvement_strategies/links/57d6ade408ae601b39ac0736/Transportation-Affordability-evaluation-and-improvement-strategies.pdf
Tom Ruffles et al. “Visible Damp in a Child’s Bedroom Is Associated with Increased Respiratory Morbidity in Early Life: A Multicentre Cohort Study.” Archives of Disease in Childhood 109, no. 10 (2024): 818–821. https://adc.bmj.com/content/109/10/818
Transport for West Midlands. “Local Transport Plan: Green Paper.” https://www.tfwm.org.uk/media/tcgf3ik2/local-transport-plan-green-paper-final.pdf.
UK Department for Business, Innovation and Skills. “UK Skills and Productivity in an International Context.” BIS Research Paper Number 704. February 2015. https://assets.publishing.service.gov.uk/media/5a807a4ded915d74e33faa79/BIS-15-704-UK-skills-and-productivity-in-an-international_context.pdf
UK Department for Energy Security and Net Zero. “Fuel Poverty Detailed Tables 2025 (2023 Data).” https://www.gov.uk/government/statistics/fuel-poverty-detailed-tables-2025-2023-data
UK Government. "Higher GCSE Grades Linked to Lifetime Earnings Boost." https://www.gov.uk/government/news/higher-gcse-grades-linked-to-lifetime-earnings-boost
UK Government. "Landfill Tax." https://www.gov.uk/green-taxes-and-reliefs/landfill-tax
UK Government. “Definition of Disability under Equality Act 2010.” https://www.gov.uk/definition-of-disability-under-equality-act-2010
UK Government. “Digital Inclusion Action Plan: First Steps.” https://www.gov.uk/government/publications/digital-inclusion-action-plan-first-steps/digital-inclusion-action-plan-first-steps
UK Government. “Fuel Poverty Statistics.” https://www.gov.uk/government/collections/fuel-poverty-statistics
UK Government. “Statutory Homelessness in England: Financial Year 2023–24.” Homelessness Statistics. https://www.gov.uk/government/statistics/statutory-homelessness-in-england-financial-year-2023-24
UK Green Building Council. “Nature-Based Solutions to the Climate Emergency.” August 2020. https://ukgbc.org/wp-content/uploads/2020/08/Nature-based-solutions-to-the-climate-emergency.pdf
UK Parliament POST. “Election Turnout: Why Do Some People Not Vote?” POSTnote 700. Published June 2024. https://post.parliament.uk/election-turnout-why-do-some-people-not-vote/.
UK Parliament. “Obesity Statistics.” Research Briefing SN03336. https://commonslibrary.parliament.uk/research-briefings/sn03336/
UK Parliament. “Written Evidence: Transport Accessibility.” Committees. https://committees.parliament.uk/writtenevidence/107021/html/.
UKCrimeStats. “West Midlands Police: Crime Statistics.” https://www.ukcrimestats.com/Police_Force/West_Midlands_Police.
Understanding Society. “Digital Exclusion Worsens Cost-of-Living Crisis.” https://www.understandingsociety.ac.uk/impact/digital-exclusion-worsens-cost-of-living-crisis/
United Nations Environment Programme. “Air Pollution and Climate Change: Two Sides of the Same Coin.” UNEP. https://www.unep.org/news-and-stories/story/air-pollution-and-climate-change-two-sides-same-coin
University of Birmingham. “West Midlands Air Pollution Causing Up to 2,300 Early Deaths Each Year.” https://www.birmingham.ac.uk/news/2024/west-midlands-air-pollution-causing-up-to-2300-early-deaths-each-year
University of Birmingham. Good Housing Better Health. 2016. https://www.birmingham.ac.uk/Documents/college-social-sciences/social-policy/SPSW/Housing/2016/good-housing-better-health-2016.pdf
Viju Raghupathi, and Wullianallur Raghupathi. “The Influence of Education on Health: An Empirical Assessment of OECD Countries for the Period 1995–2015.” Archives of Public Health 78, no. 20 (2020). https://doi.org/10.1186/s13690-020-00402-5
Waste Managed. “UK Landfill Impact Guide 2025.” https://www.wastemanaged.co.uk/our-news/general-waste/uk-landfill-impact-guide/
West Midlands Combined Authority. “Air Quality.” https://www.wmca.org.uk/what-we-do/environment-energy/air-quality/
West Midlands Combined Authority. “Circular Economy Routemap 2024.” https://www.wmca.org.uk/media/zfdibyx1/circular-economy-routemap-2024.pdf
West Midlands Combined Authority. “Cycling and Walking in Birmingham.” https://www.wmca.org.uk/in-my-area/projects/cycling-and-walking-in-birmingham/
West Midlands Combined Authority. “Designing Out Homelessness: Briefing Paper.” https://www.wmca.org.uk/media/zqvbxm4t/designing-out-homelessness-briefing-paper.pdf
West Midlands Combined Authority. “Digital Inclusion.” https://www.wmca.org.uk/documents/levelling-up/west-midlands-levelling-up-prospectus/west-midlands-levelling-up-growth-prospectus/section-c-public-services-pride-in-place/digital-inclusion/
West Midlands Combined Authority. “Economic Impacts Assessment Executive Summary.” https://www.wmca.org.uk/media/zw5dfb2k/economic-impacts-assessment-executive-summary.pdf
West Midlands Combined Authority. “Election Results.” https://governance.wmca.org.uk/mgElectionAreaResults.aspx?ID=12
West Midlands Combined Authority. “Employment and Skills Strategy 2024–2027.” https://www.wmca.org.uk/media/wtwpjng2/wmca-employment-and-skills-strategy-2024-2027.pdf.
West Midlands Combined Authority. “Environment and Energy.” https://www.wmca.org.uk/what-we-do/environment-energy/
West Midlands Combined Authority. “GHG Emissions in the West Midlands Combined Authority.” https://www.wmca.org.uk/documents/environment-energy/five-year-plan/overview/where-are-we-now/ghg-emissions-in-the-west-midlands-combined-authority/
West Midlands Combined Authority. “Improving the Level 3 Skills Offer for Adults.” https://www.wmca.org.uk/what-we-do/employment-and-skills/improving-the-level-3-skills-offer-for-adults/
West Midlands Combined Authority. “Making the West Midlands an Exemplary Region for Disabled People.” https://www.wmca.org.uk/media/fyslerne/making-the-west-midlands-an-exemplary-region-for-disabled-people-final.pdf
West Midlands Combined Authority. “Mental Health Commission: A Year On Report.” https://www.wmca.org.uk/media/cmiel4au/mental-health-commission-a-year-on-report-final.pdf
West Midlands Combined Authority. “Nature Based SuDS Guidance Document.” July 2024. https://wmca.assetbank-server.com/assetbank-wmca/action/viewAsset?id=26563&index=0&total=1&view=viewSearchItem
West Midlands Combined Authority. “Race Equalities Taskforce: Why Set Up the Taskforce?” https://www.wmca.org.uk/what-we-do/inclusive-communities/race-equalities-taskforce/why-set-up-the-taskforce/
West Midlands Combined Authority. “Strategic Economic Plan: Full SEP Document.” https://www.wmca.org.uk/media/1382/full-sep-document.pdf
West Midlands Combined Authority. “Summary of Climate Change Impacts in the WMCA Area.” https://www.wmca.org.uk/media/d2pons0q/summary-of-climate-change-impacts-in-wmca-area.pdf
West Midlands Combined Authority. “Towards Mental Health Equality.” https://www.wmca.org.uk/media/y4ydrje1/mental-health-report.pdf
West Midlands Combined Authority. “Valuing the West Midland’s Urban Forest.” https://www.wmca.org.uk/media/3kzjkgy3/wmca-i-tree-overview.pdf
West Midlands Combined Authority. “West Midlands Greener Together Citizens’ Panel 2022–2024.” https://www.wmca.org.uk/documents/environment-energy/greener-together-citizens-panel-resources/greener-together-citizens-panel-leaflet/west-midlands-greener-together-citizens-panel-2022-2024/
West Midlands Combined Authority. “West Midlands Levelling Up Growth Prospectus: Section A – Going Further, Faster – Retrofit.” https://www.wmca.org.uk/documents/levelling-up/west-midlands-levelling-up-prospectus/west-midlands-levelling-up-growth-prospectus/section-a-going-further-faster/retrofit/
West Midlands Combined Authority. “West Midlands Natural Environment Plan 2021–2026: Access to Green and Blue Spaces.” https://www.wmca.org.uk/documents/environment-energy/natural-environment-plan/west-midlands-natural-environment-plan-2021-2026/access-to-green-and-blue-spaces/
West Midlands Combined Authority. “West Midlands Plan for Growth: Scale of the Economic Challenge.” https://www.wmca.org.uk/documents/strategies/plan-for-growth/west-midlands-plan-for-growth/scale-of-the-economic-challenge/
West Midlands Combined Authority. “West Midlands State of the Region 2024–2025.” https://www.wmca.org.uk/media/bzqbvuoh/west-midlands-state-of-the-region-2024-2025.pdf.
West Midlands Combined Authority. “Climate Risk and Vulnerability Assessment (CRVA).” https://west-midlands-combined-authority.github.io/crva/.
West Midlands Combined Authority. “Include Me WM Report: Improving the Life Chances of Disabled Citizens in the West Midlands by Being Active.” https://www.wmca.org.uk/media/3099/include-me-wm-report.pdf
West Midlands Combined Authority. “Race Equalities Taskforce Applicant Webinar.” https://www.wmca.org.uk/media/5342/information-slides-race-equalities-taskforce-applicant-webinar.pdf
Women’s Budget Group. “The Feminist Future of Work.” 2024. https://www.wbg.org.uk/wp-content/uploads/2024/09/The-feminist-future-of-work_FINAL.pdf
World Health Organization. “Healthy Diet.” https://www.who.int/initiatives/behealthy/healthy-diet
Zoe E Reed et al. “Investigating the Impact of Loneliness and Social Isolation on Health.” https://media.nesta.org.uk/documents/Investigating_the_impact_of_loneliness_and_social_isolation_on_health_gABvSUB.pdf