How to use the map
Due to a technical problem some layers may not work, for example the Active Lives layer. We are working to fix this.
The map works best in the Microsoft Edge web browser.
Tutorial
Structure of the map
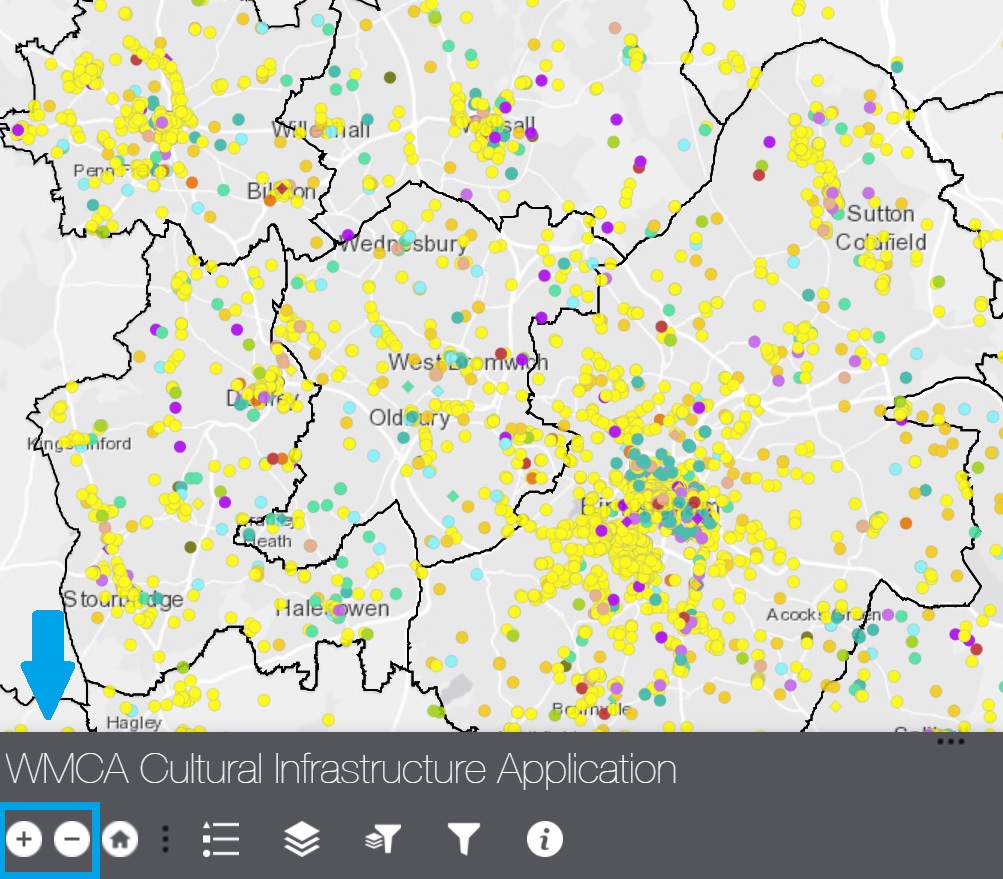
The image below shows how the map should look like as you access the application.
It includes a map layer and each individual piece of cultural infrastructure is included as a coloured spot.
You can zoom in and out using the plus and minus signs circled here in blue.
You can also move the map by putting your cursor on the map and then grabbing it by clicking your left mouse button.
Cultural Infrastructure Typologies
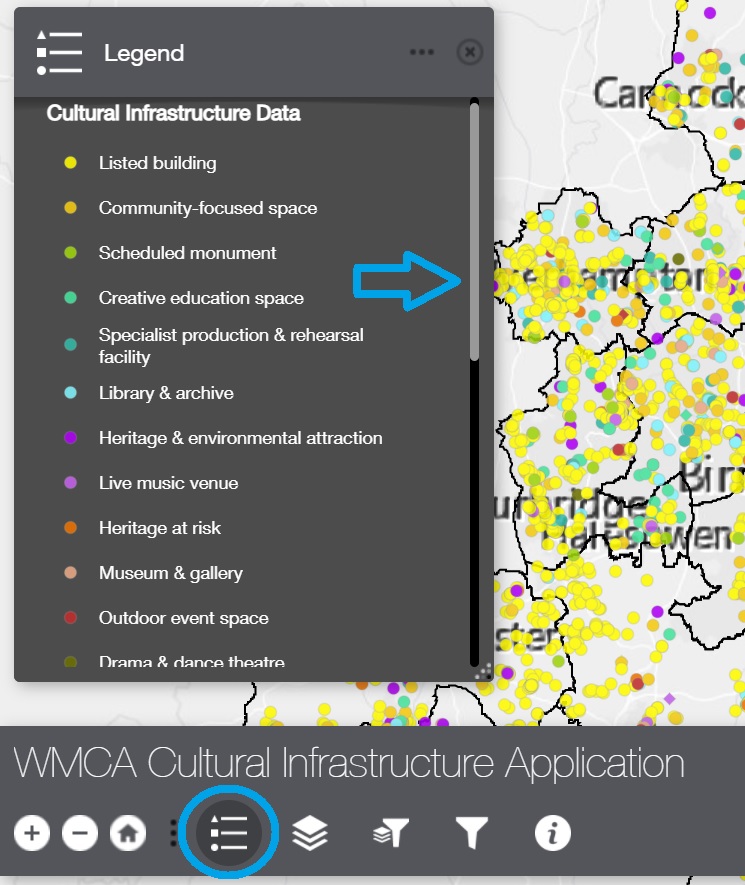
Types of cultural infrastructure: To look at the different types of cultural infrastructure, you can click on the ‘legend’ button on the bottom panel that enables you to look at the colour and shape indicators of each type of cultural infrastructure included. You can use the sidebar to scroll up and down.
Select the ‘legend’ button to view which types of cultural infrastructure the different colours and shapes indicate.
Layers
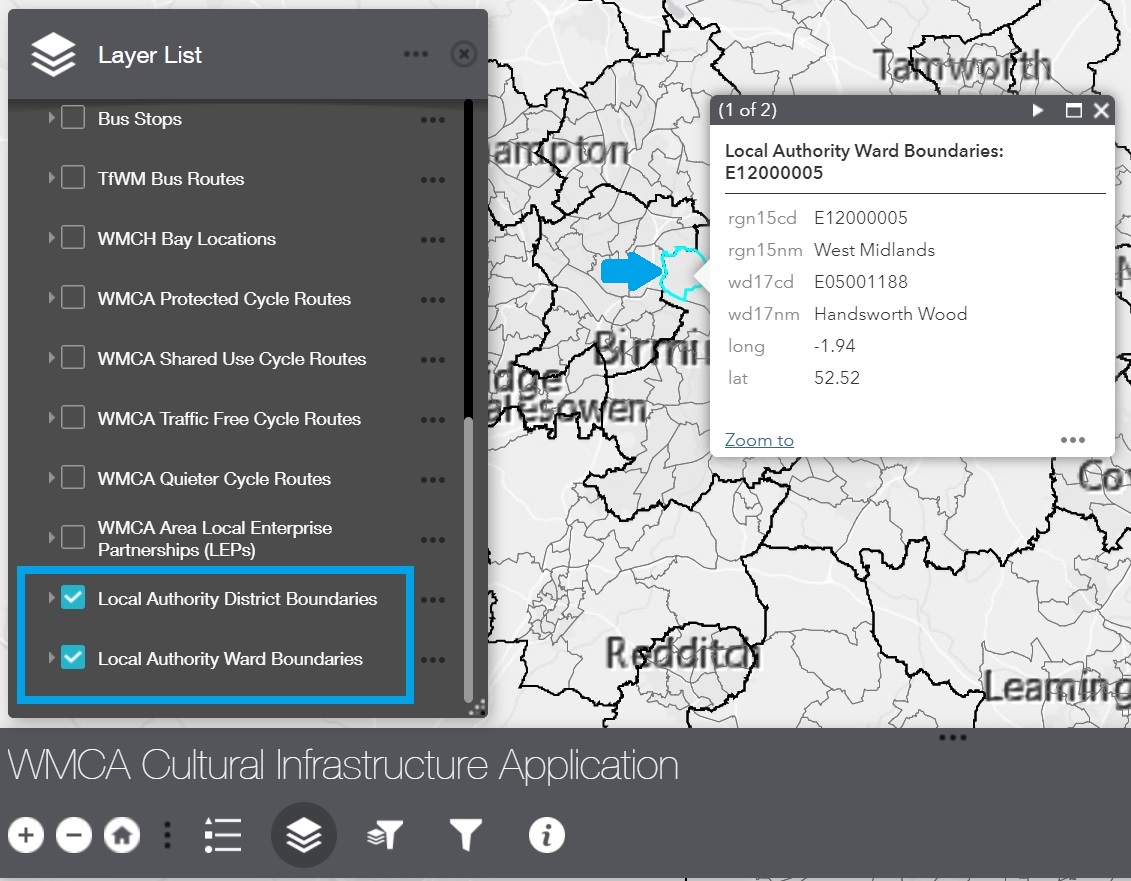
Select the ‘layer list’ button on the dashboard to view the available layers.
To look at the different types of layers on the map, click the ‘layer list’ button on the bottom of the dashboard. This will open a list of different type of layers. To make these layers visible on the map, click the box next to the layer you would like to see. You can also select multiple layers.
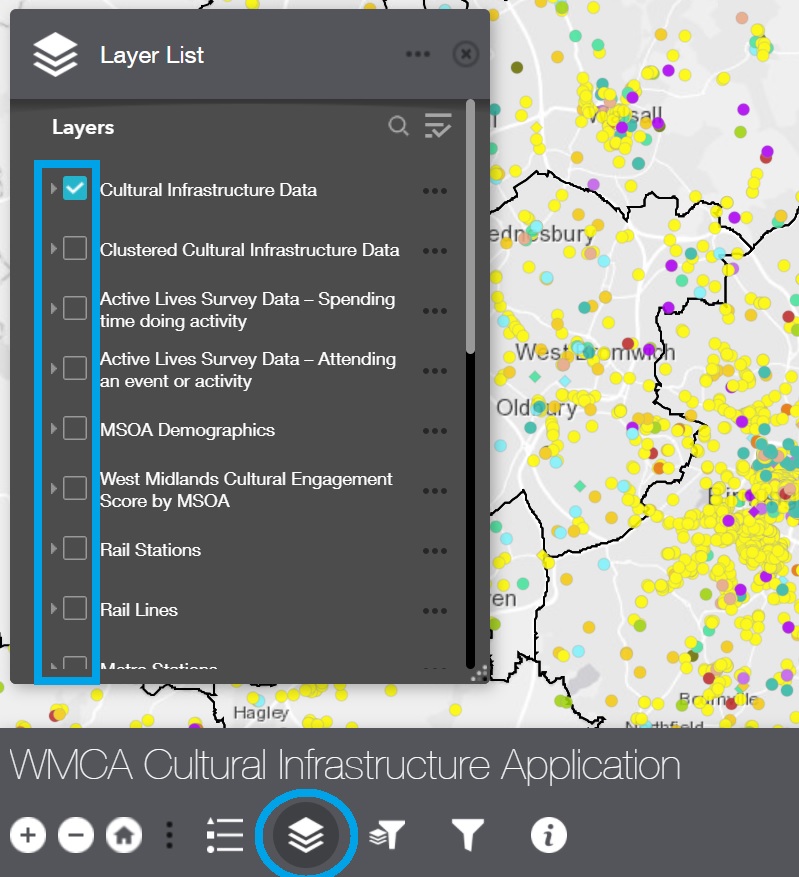
You can also reveal more information about each layer by clicking the small arrow next to each box.
The layers include:
- Cultural Infrastructure Data – shows the infrastructure as individual spots as outlined earlier. We recommend you keep this layer selected if you want to see how individual infrastructure relates to the other layers.You can click any of the individual spots to see a pop-up window which provides more information on the piece of infrastructure including a website, the type of infrastructure and where applicable, venue capacity. The venues have been divided into ‘Small – Medium – Large – Very Large’ categories for this purpose. You can again use the scroll bar on the right to go through the information.
You can also reveal additional information by clicking the arrow on the top of the pop-up window.
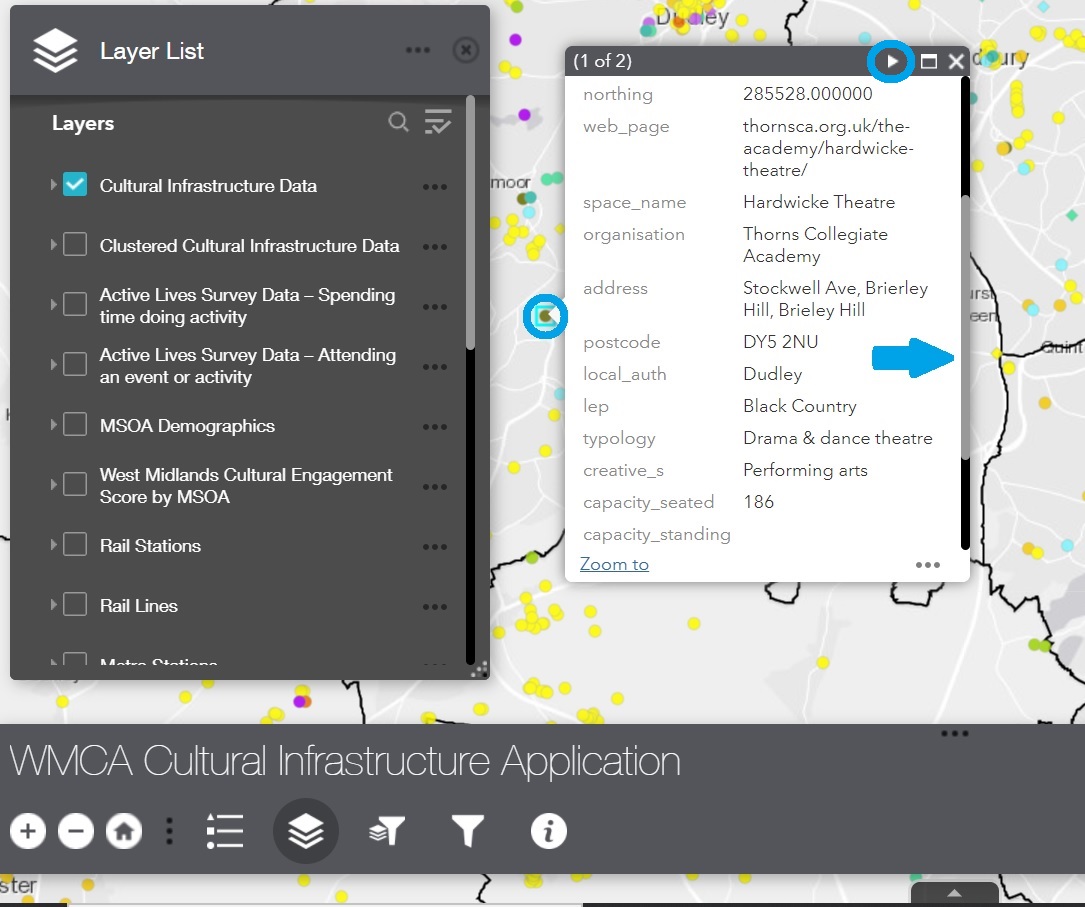
Select a spot to view a pop-up window with more information on the piece of infrastructure. This can include the website, type of infrastructure and venue capacity. Select the small arrow on the top right corner of the pop-up window to view additional information.
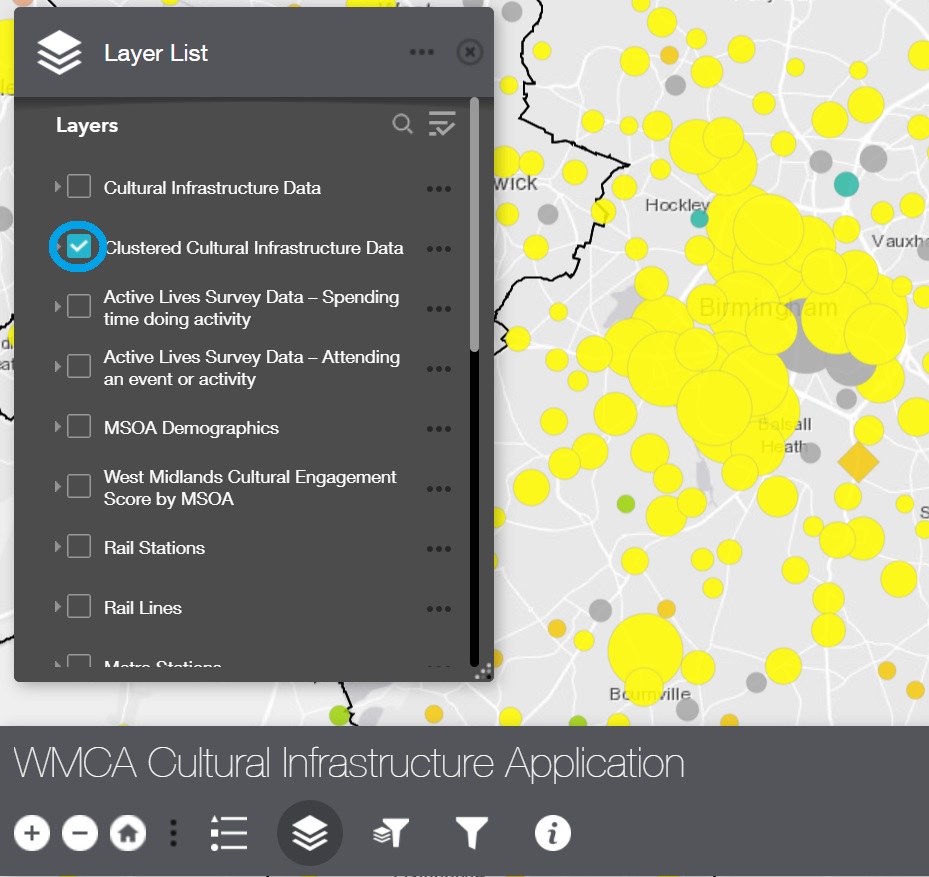
- Clustered Cultural Infrastructure Data - enables you to look at the data in cluster mode. If you use this layer, we recommend you unclick the top one for individual infrastructure spots
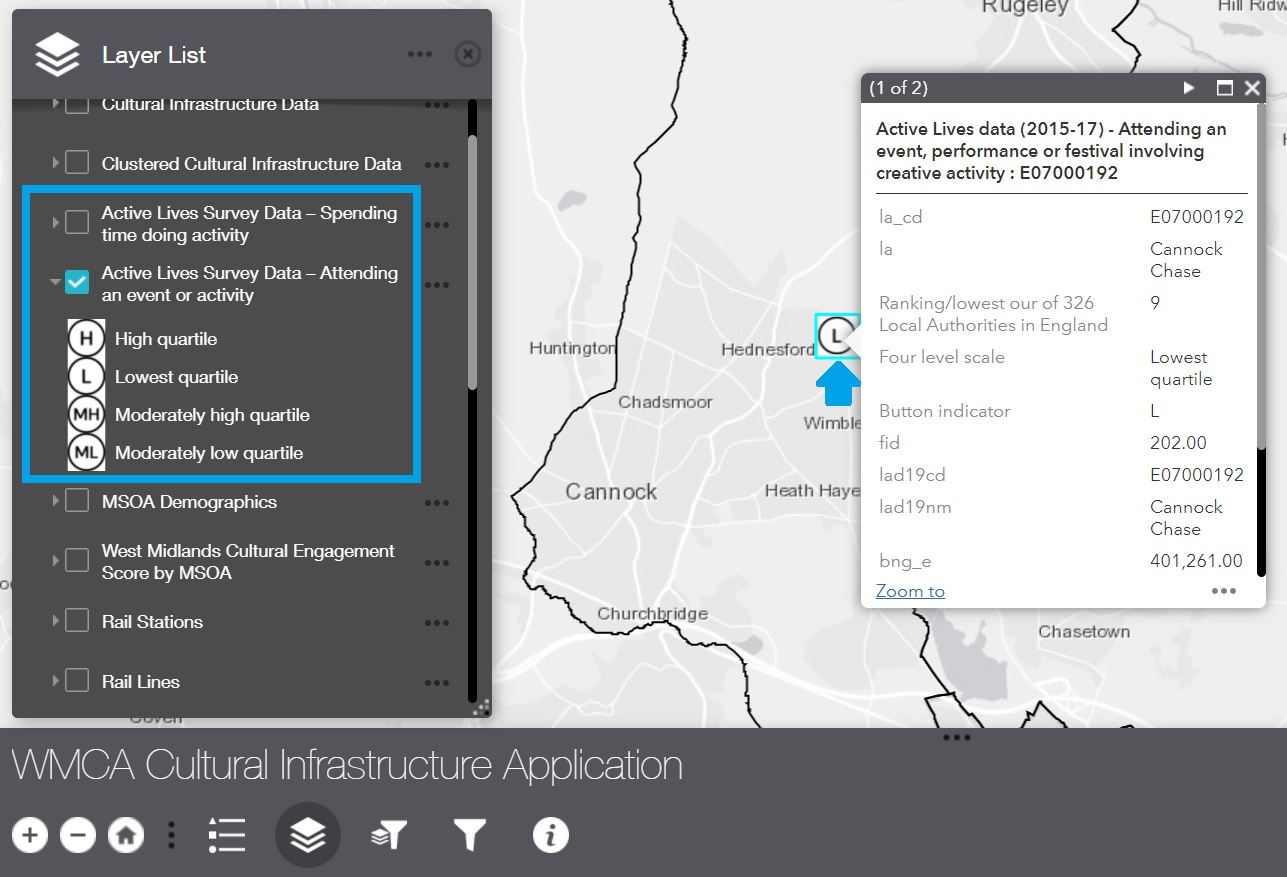
- Active Lives Data (2015 – 2017) layers - provides an indication of cultural participation for each local authority.
For this layer, we recommend you only select one the options at the time, either:
- Spending time doing activity, OR
- Attending an event or activity
The data is presented in the form of ‘buttons’ that represent the level of engagement within a Local Authority when compared with other areas in England. You can click the layer for Local Authority District Boundaries to see the boundaries. The levels of engagement are divided into:
Levels of engagement
Within the lowest quartile in England (e.g. 0 – 25%).
Within the medium-low quartile in England.
Within the medium-high quartile in England.
Within highest quartile in England.
Click the engagement symbol on the map to view a pop up showing:
- The percentage of population engaging within the selected local authority
- The ‘ranking’ of the local authority as lowest out of 326. For example, if the ranking is 2, this means the Local Authority is the second lowest for engagement in England for the category you are looking at.
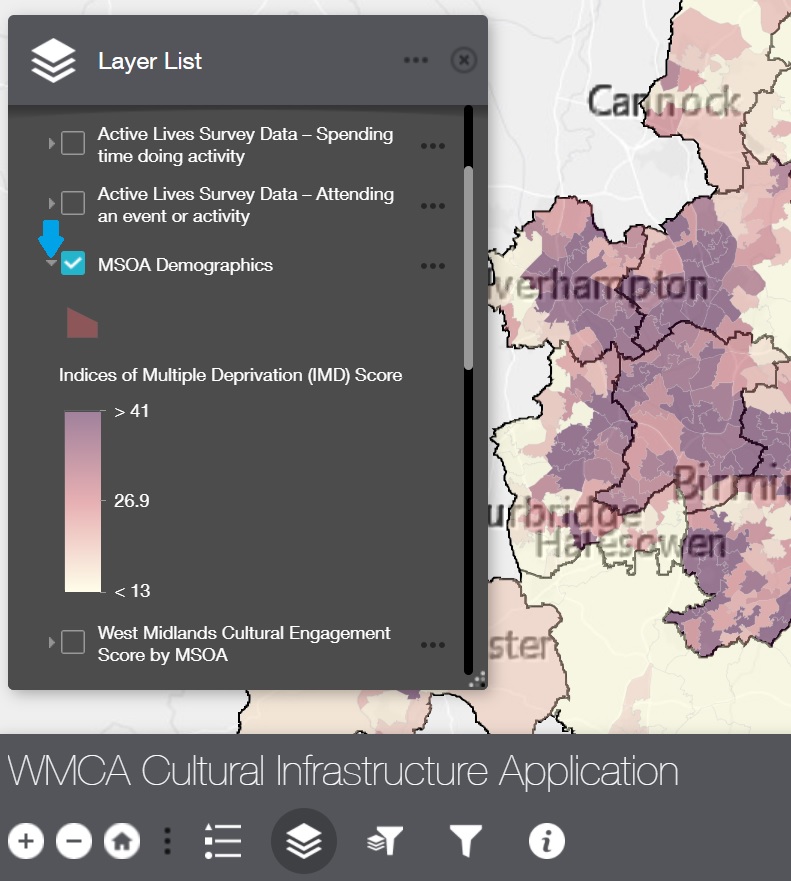
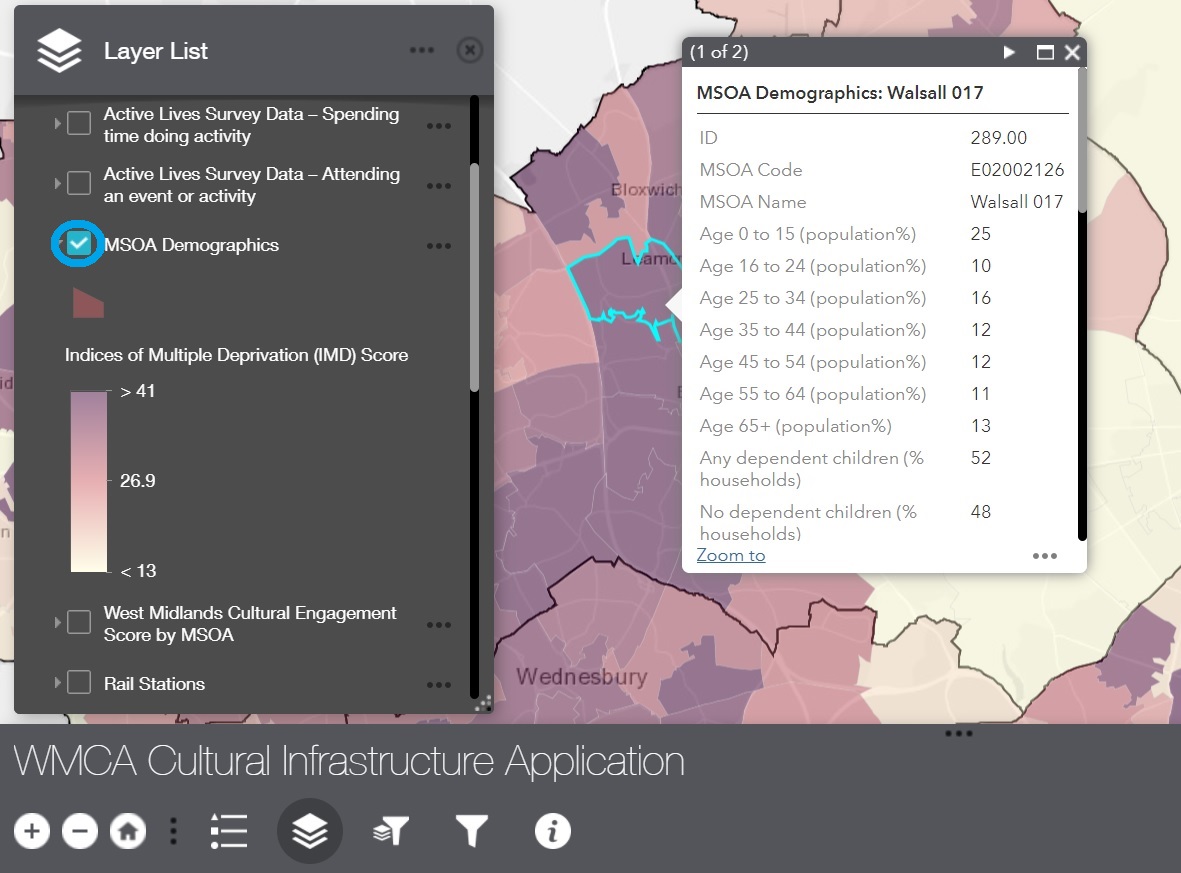
- MSOA (Middle Layer Super Output Areas) are a geographic hierarchy designed to improve the reporting of small area statistics in England and Wales. Selecting this layer and then clicking on any of the areas will provide information about demographics for the selected MSOA including information on social grade, age and ethnicity, for example.
You can again use the side bar on the pop-up window to scroll up and down.
The colours on the map indicate the Indices of Multiple Deprivation (IMD) score for each MSOA. A darker colour indicates a higher score and higher levels of deprivation.
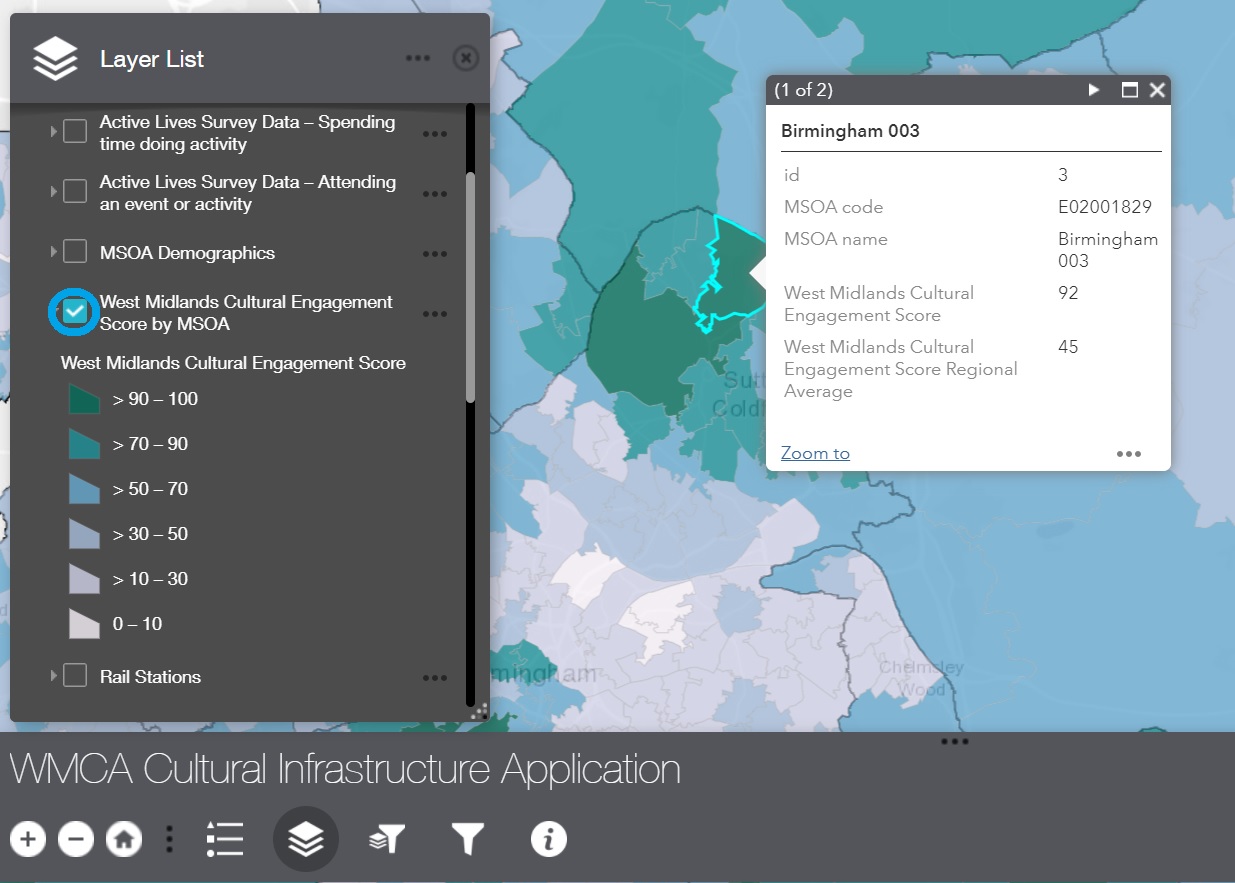
- West Midlands Cultural Engagement Score is a completely new metric for cultural engagement. It has been created as part of the wider research project and only applies to the West Midlands.
Each MSOA area has been allocated a cultural engagement score between zero and hundred (0 – 100). A higher score indicates higher levels of cultural engagement. The average score for the West Midlands is forty-five (45). On the map, higher scoring areas appear as dark green, as areas with a lower score have a light colour.
By clicking an MSOA area on the map, you can see a pop-up window which shows the score for that MSOA.
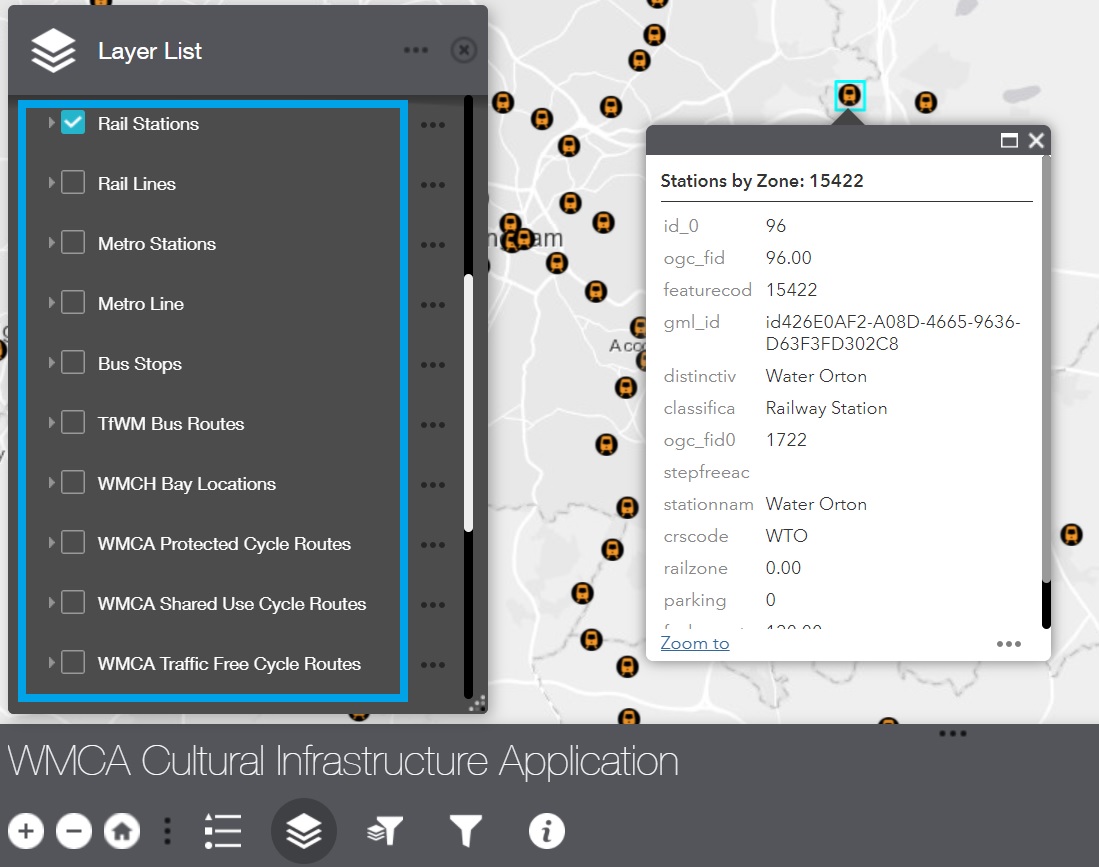
- Transport data layers include a number of different layers including railway stations, rail lines, metro stations, bus information and cycle information. Select one or more relevant layers. Again, you can choose multiple layers at the same time – remember to select the cultural infrastructure layer at the top of the list if you want to view how the transport infrastructure relates to the cultural one.
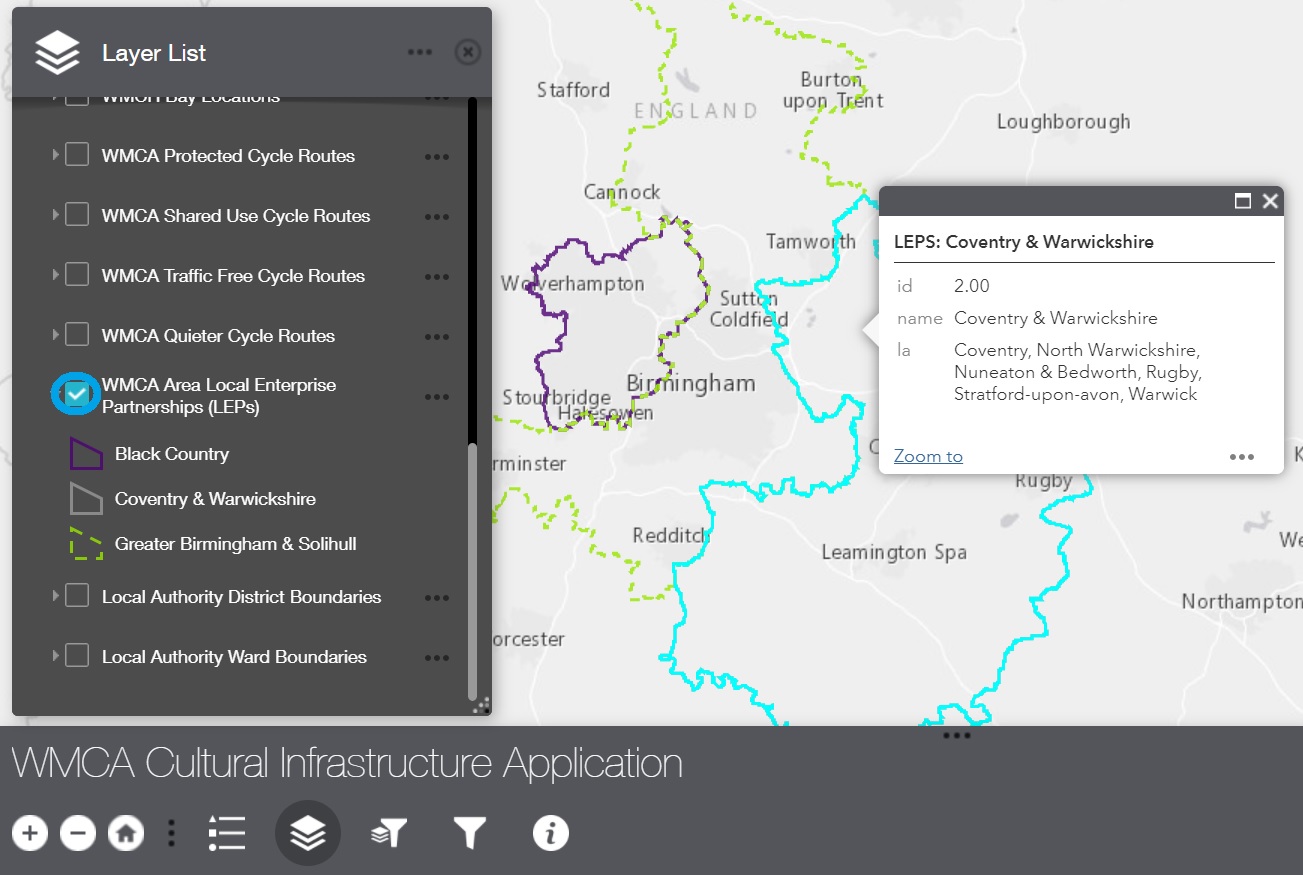
- Local Enterprise Partnership (LEP) layer outlines the three LEP areas within the WMCA area including Greater Birmingham & Solihull LEP, Black Country LEP and Coventry & Warwickshire LEP. Select the area to reveal the pop up that gives you the name of the LEP area. You can also tick the Local Authority District Boundaries layer to find out which local authorities sit within each LEP area.
- Local authority layers enable you to look at the local authority and ward boundaries. You can also select the local authority or ward on the map to view it in more detail.
Local Authority Area Filter
You also have the option to select specific areas to look at.
To do this, select the Local Authority Area Filter button at the bottom of the dashboard. This will bring up a new window which allows you to select the areas you want to focus on.
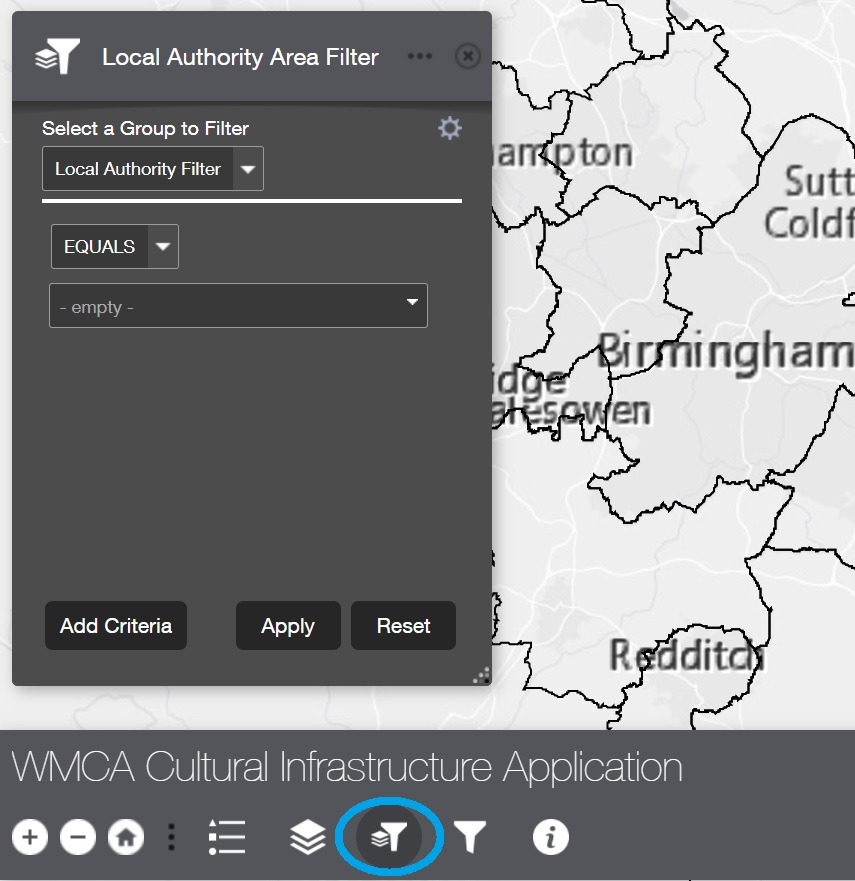
To do this, click on the ‘empty’ drop-down menu and then choose the local authority you want to look at.
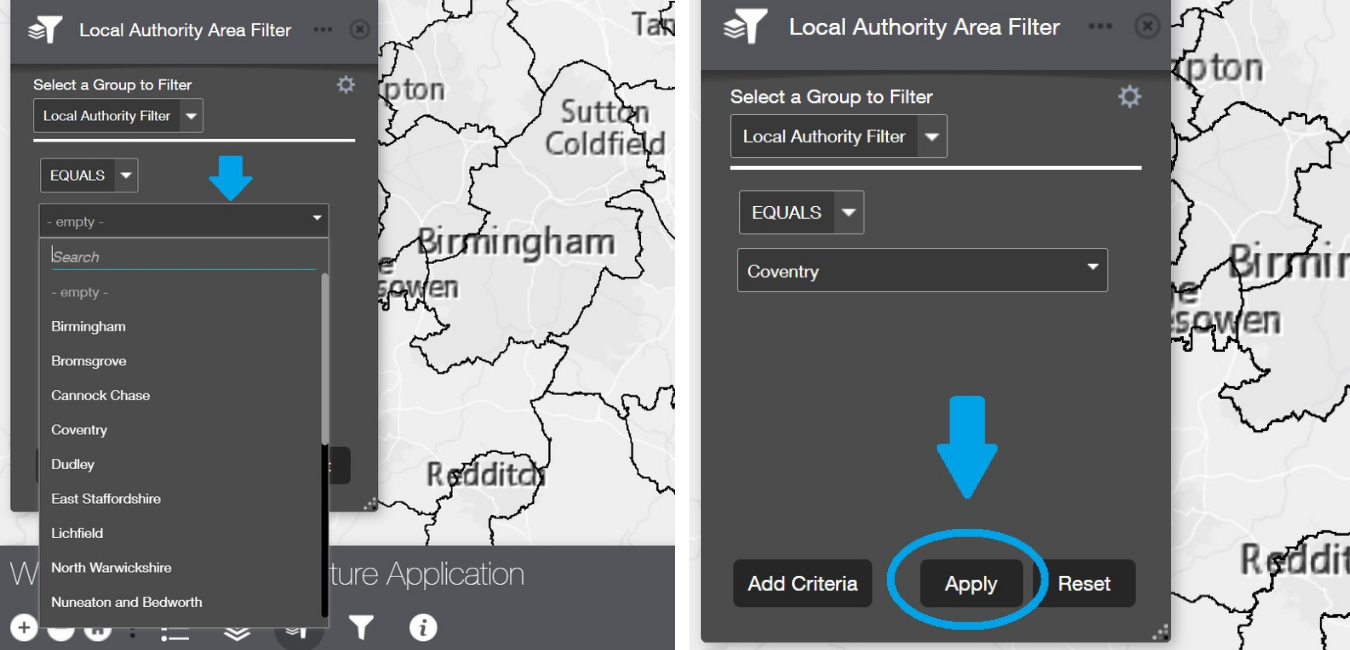
After selecting your area, click ‘Apply’ in the pop-up window.
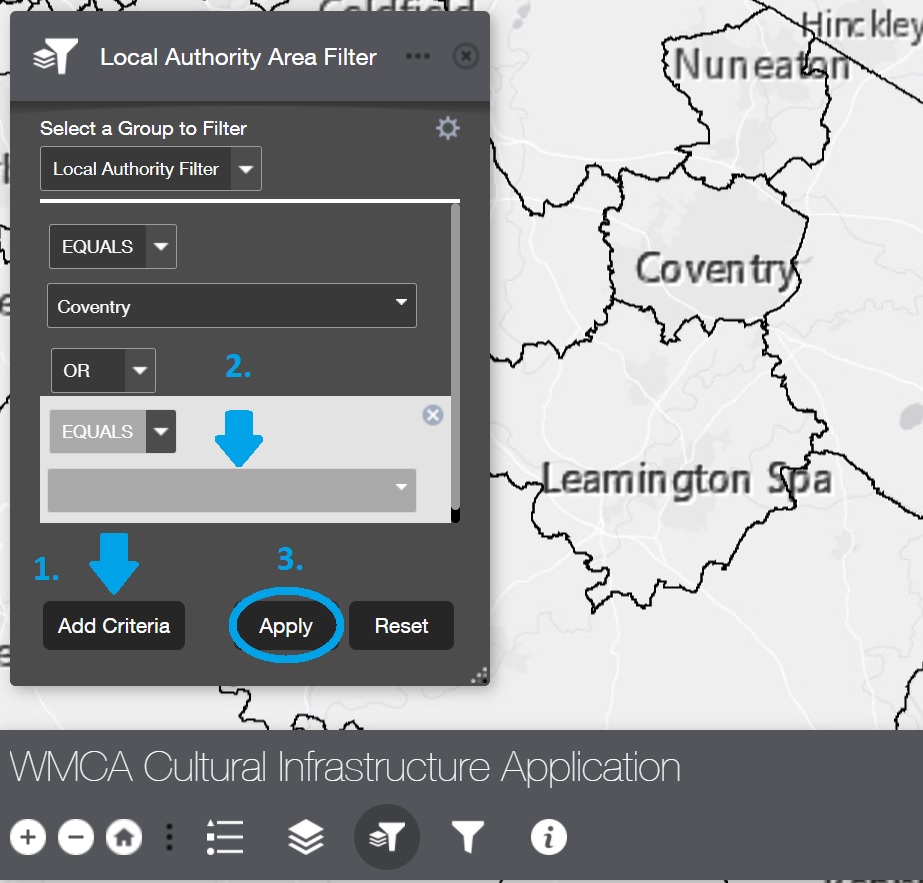
If you want to select more than one local authority, click on the ‘Add Criteria’ button on the pop-up window. This will give you another drop-down menu to choose another area.
Remember to click ‘Apply’ after selecting to show the changes on the map.
Cultural Infrastructure Data Filter
Use this to choose:
- specific types of cultural infrastructure which you can then view as individual spots or clusters.
- specific seating capacity
To access this function, select the Culture Data Filter button on the main dashboard. This will launch a pop-up window which will allow you to select data.
Note that the capacity filters do not work if you have selected the clustered data option. You need to have the individual spots of cultural infrastructure selected for this function to work.
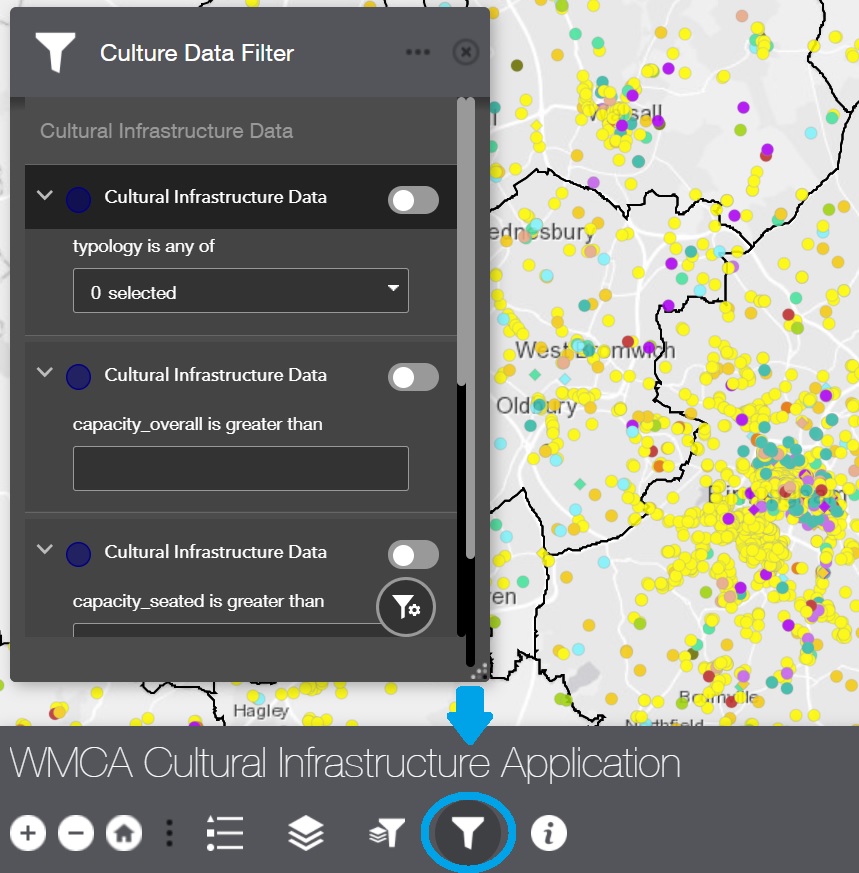
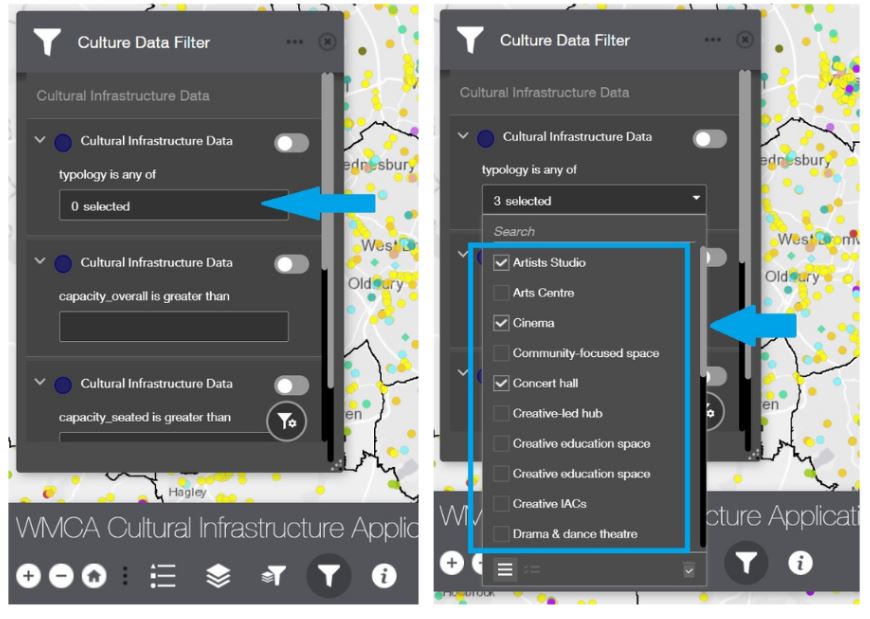
To select individual spots of cultural infrastructure within the different categories, click on ‘0 selected’ and you can then select the types of typologies you want to include.
You can use the scroll bar on the right side to scroll types of infrastructure.
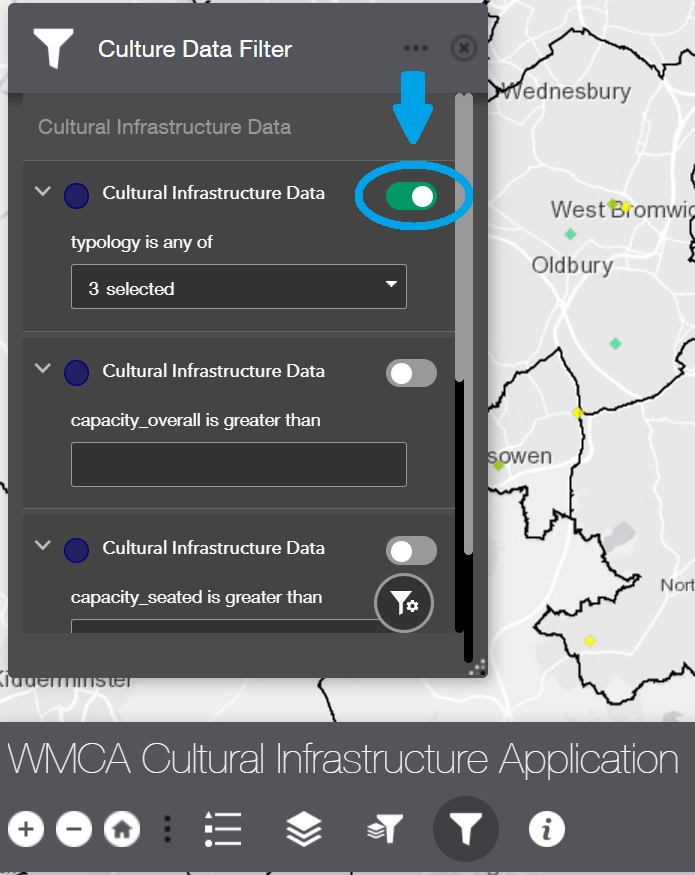
To see the selection, select the button by the side of the menu as indicated below.
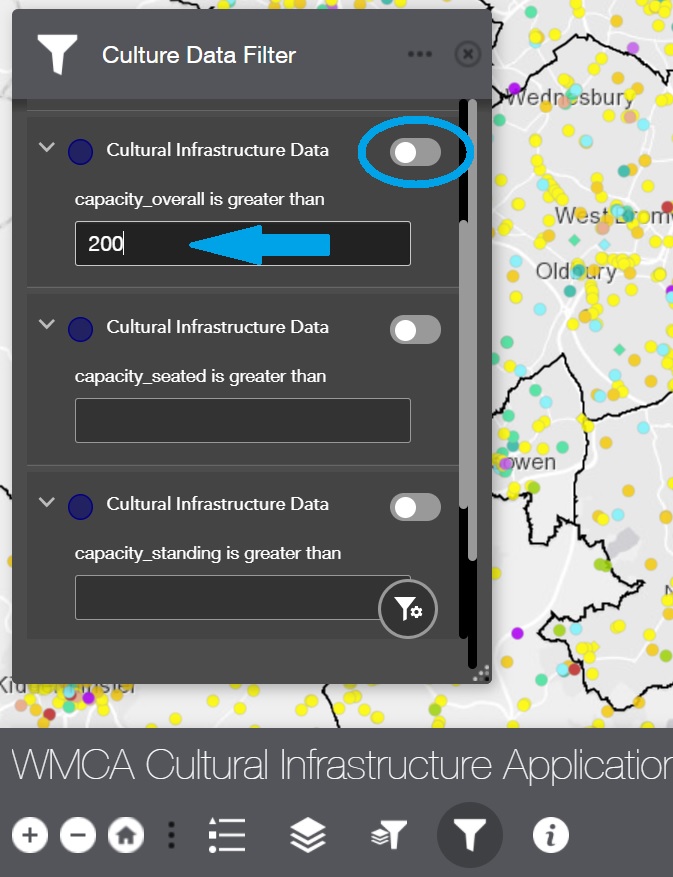
To filter the types of infrastructure based on seating capacity, write the number you want into the free type box as outlined below. In the example below the capacity search is set for 200.
Remember to click the button on the right side to make the venues visible on the map. You can search for overall venue capacity, seating capacity or standing capacity – where this has been made available for us.
Data Sets
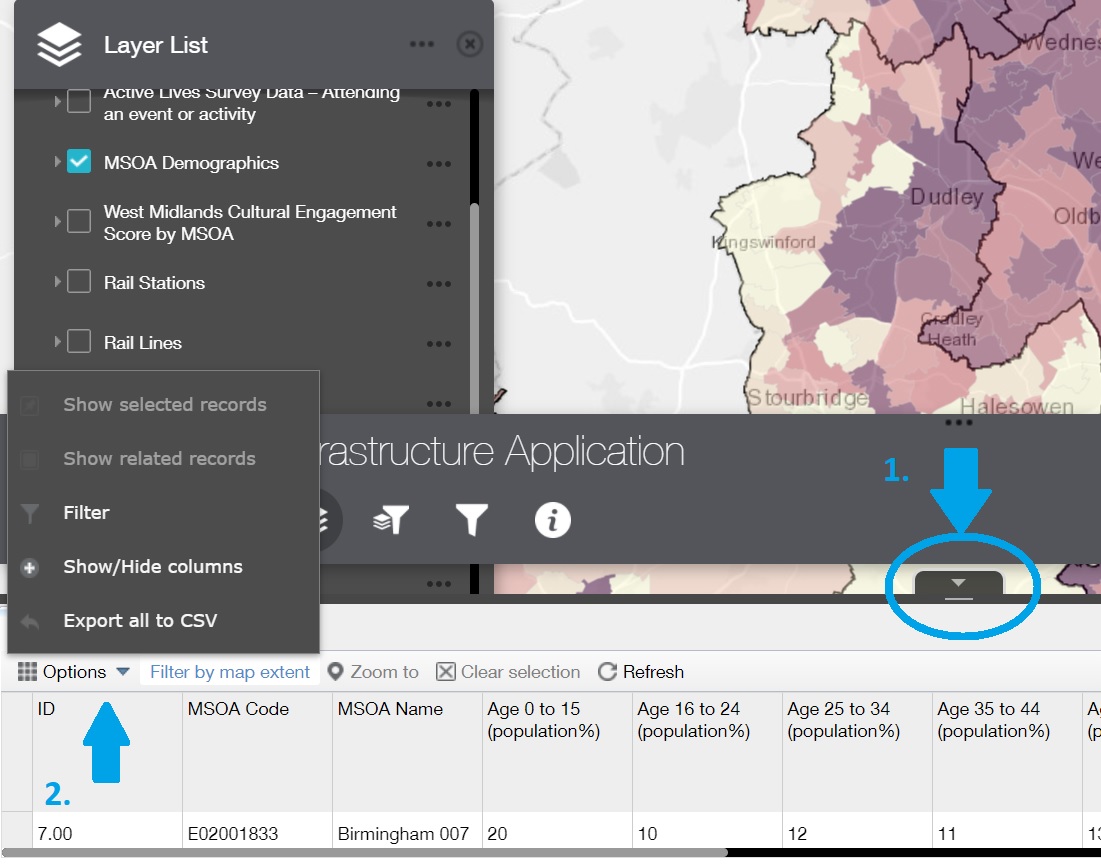
You can also download the data as an excel/CSV file. To do this, select the small arrow on the bottom of the dashboard. This will open a new dashboard where you can choose which data sets you would like to download or view.
The ‘Options’ menu will give you the ‘Export’ option.
Note that the data is automatically filtered to the selection on the map. If you want to download all the data, you need to select this using layers and other filters.